|
⚠Danger |
|
This section describes the graphical illustration method for helping the user achieve quick and convenient configuration as well as establish the configuration compatible with the PLC application. In the meantime, this section also explains the corresponding information setting instructions. Detailed description will be provided in the paragraph below.
10-1 Creating Module Layout Drawing
Page Display
Click [Project] → [Device View] in function toolbar, and the module management page will appear as below:
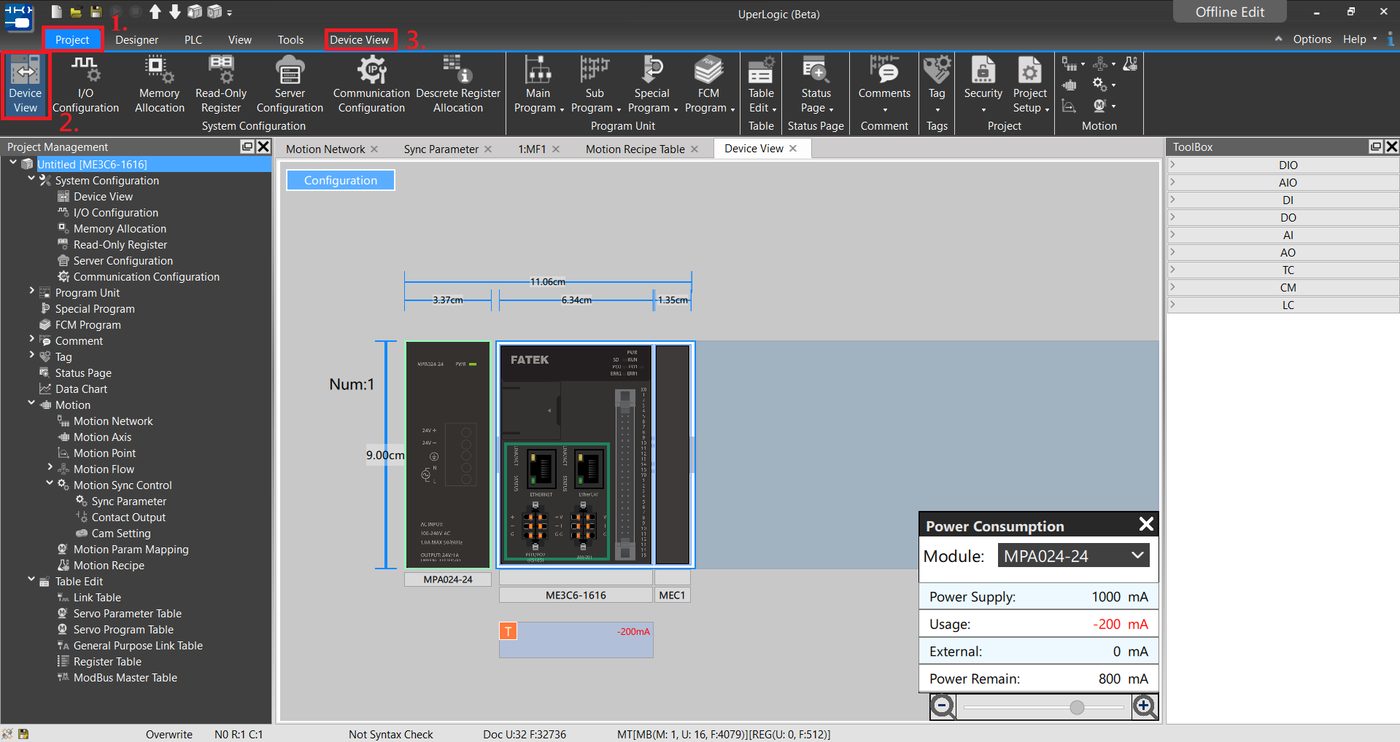
Fig. 207: Module management page
Click the toolbar icon, and you can call out following functions:
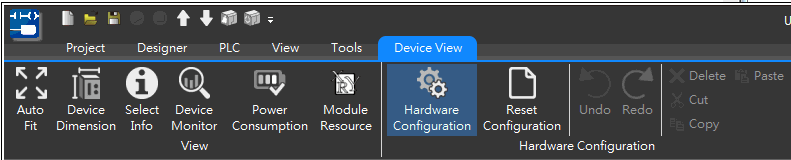
Fig. 208: Related functions of Module management page
|
Function |
Description |
Detailed introduction |
|
Auto Fit |
Compress and expand the module to appropriate position automatically. |
|
|
Device Dimension |
Indicate the dimensions of the equipment. |
Please refer to Section 10.1.3 |
|
Select Info |
Display the information of the selected equipment such as ID, firmware version, hardware version, serial number and description, etc. |
Please refer to Section 10.1.2 |
|
Device Monitor |
Display the status of the selected module on the right-hand side. |
Please refer to Section 10.3 |
|
Power Consumption |
Calculate the power consumption status of all components being expanded until now. |
Please refer to Section 10.4 |
|
Module Resource |
Display the resource occupying status of such module at the lower side of the module. |
Please refer to Section 10.1.4 |
|
Hardware Configuration |
Display the module in the toolbox for users to expand the module. |
Please refer to Section 10.1.1 |
|
Reset Configuration |
Reset the module. After being pressed, it will remove all of the expanded components in the PLC and then return to initial status. |
|
|
Undo |
Return to the previous step. |
|
|
Redo |
Redo the next step. |
Table 25: Introduction of equipment window items
10-1-1 Operation setting
First, click [Hardware Configuration]. Next, select the module from the right-side toolbox and then drag it to the PLC module. During the dragging process, the intended configuration position will show yellow, as per the figure below. When the module reaches the rear section of the existing module, it will be placed at the rearmost end of the module automatically. By double clicking the module in the toolbox, the system will add new module to the rearmost end of the module that has been configured.
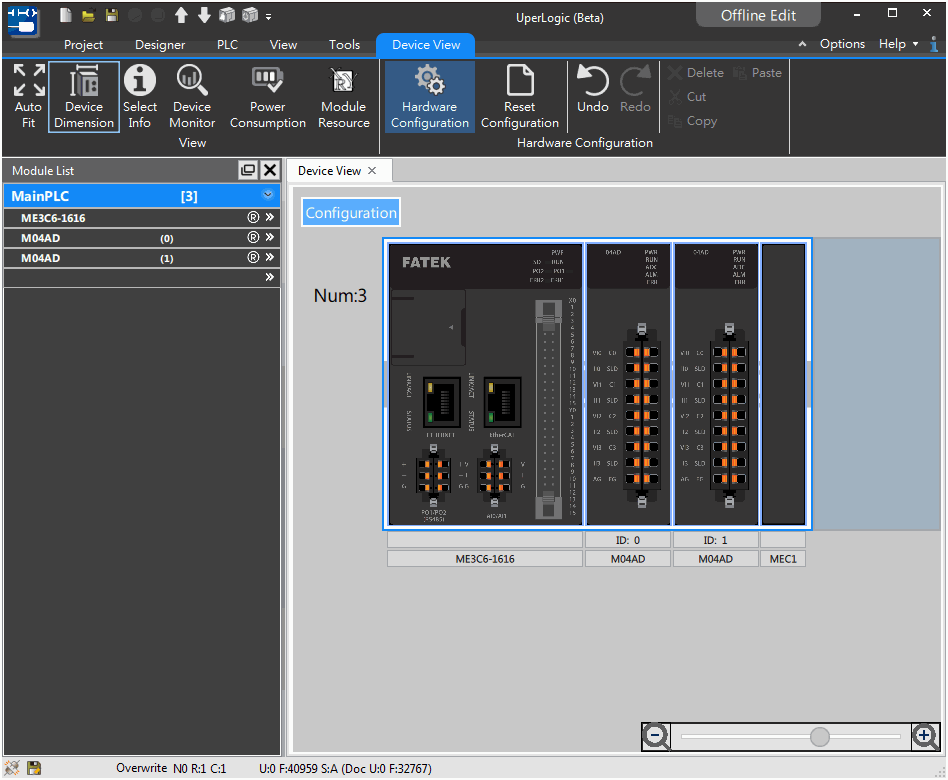
Fig. 209: Dragging the module to the rear section
The user may drag the module for adjusting the position of the added module in order to match with actual PLC configuration pattern.
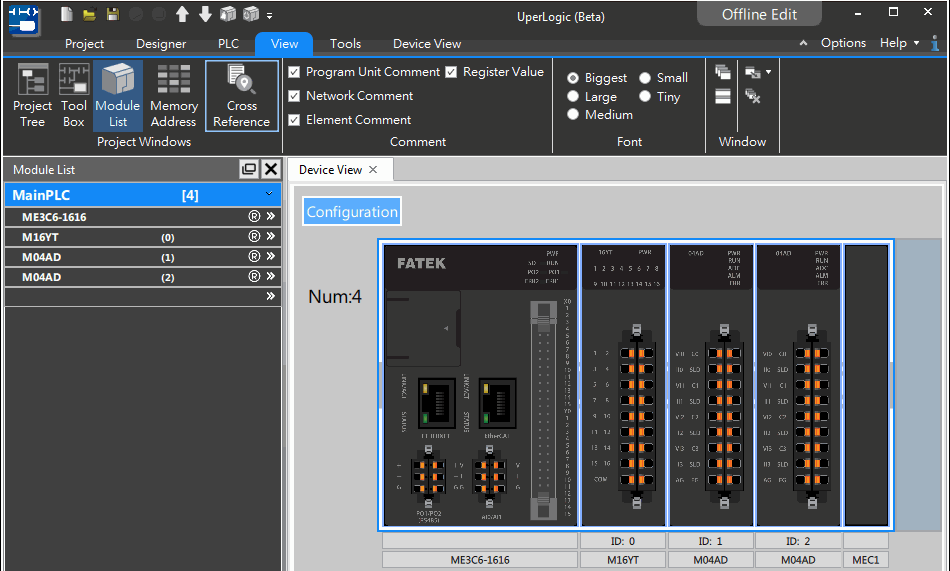
Fig. 210: Dragging module to the space between modules
Caution:
You cannot click [Download] if the expansion module in UperLogic is incompatible with the connected physical module. In this case, you will be allowed to use the uploading function only.
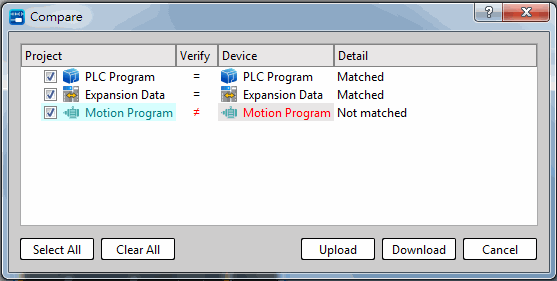
Fig. 211: Download remains inactive if incompatible with the module
10-1-2 Module information
Click [Project] → [Device View] → [Select Info] in function toolbar, and then move the cursor to the target module. Next, click the left mouse button and the window will show the information of the selected module such as version number, number of terminal board point and remark, etc., as per the figure below:
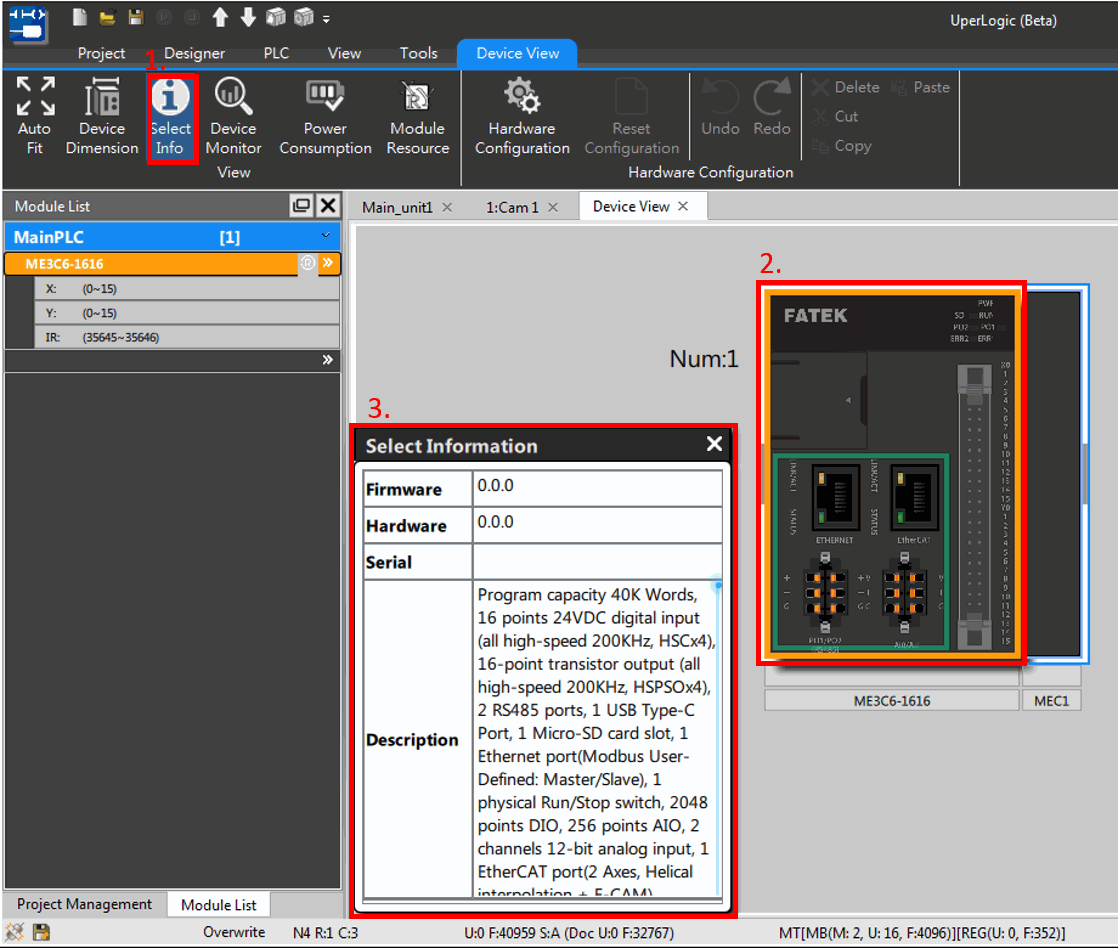
Fig. 212: Module information
10-1-3 Device Dimension
This feature facilitates system planning by determining the required equipment space for the actual machine size. Click [Project] → [Device View] → [Device Dimension] in function toolbar and the module dimensions will be displayed in the webpage, as per the figure below:
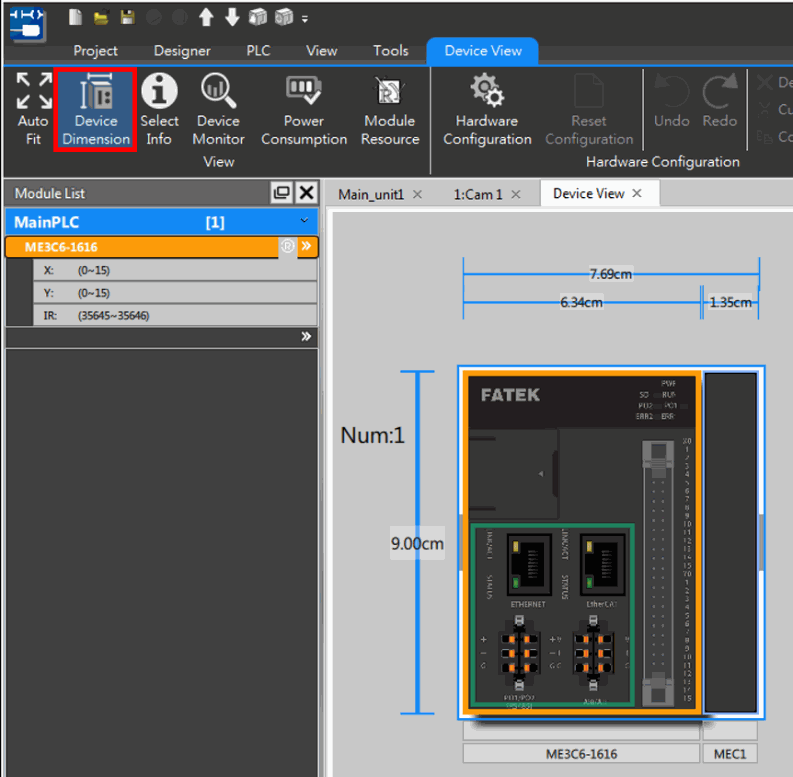
Fig. 213: Module dimensions
10-1-4 Module Resource
Click [Project] → [Device View] → [Module Resource] in function toolbar and the resource consuming status of each module will be displayed in the webpage, as per the figure below:
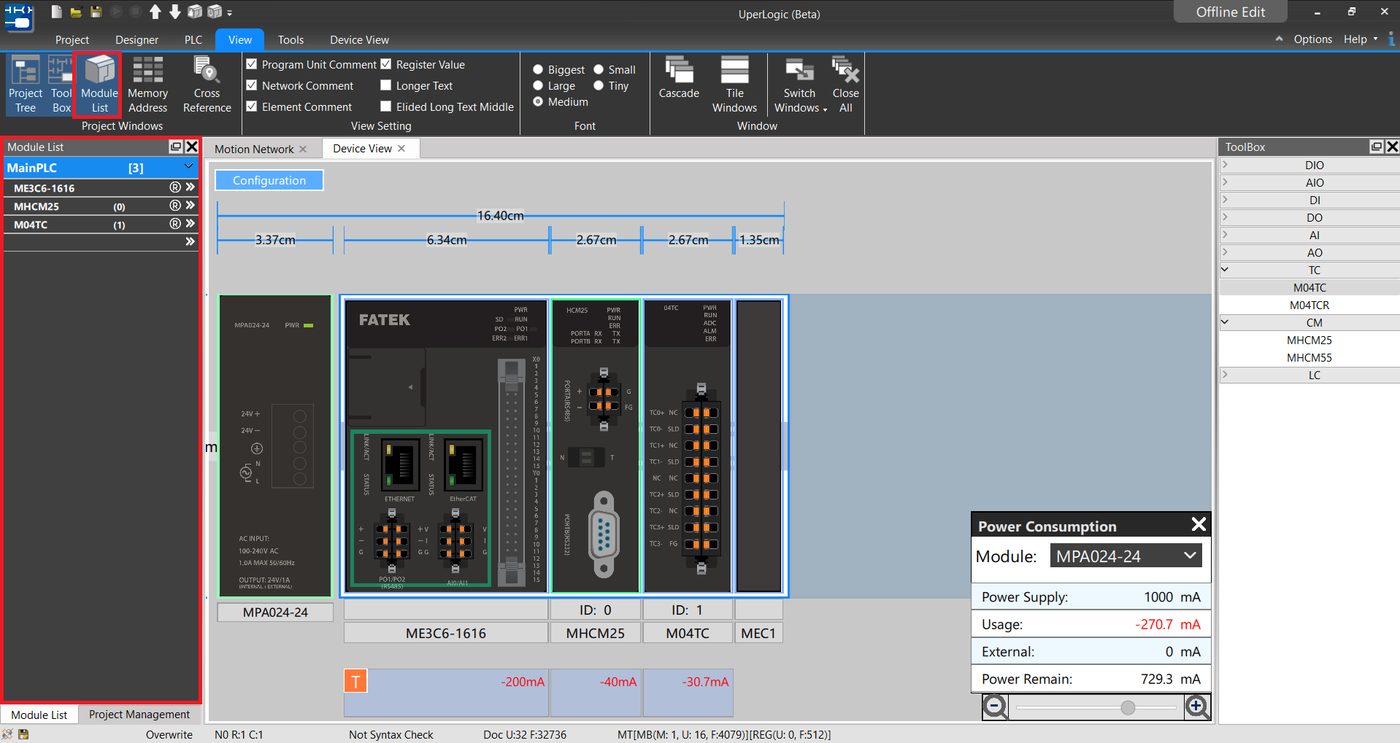
Fig. 214: Module Resource
10-2 Module List
Click [View] → [Module List] in function toolbar, and the module management page will be displayed, as per the figure below:
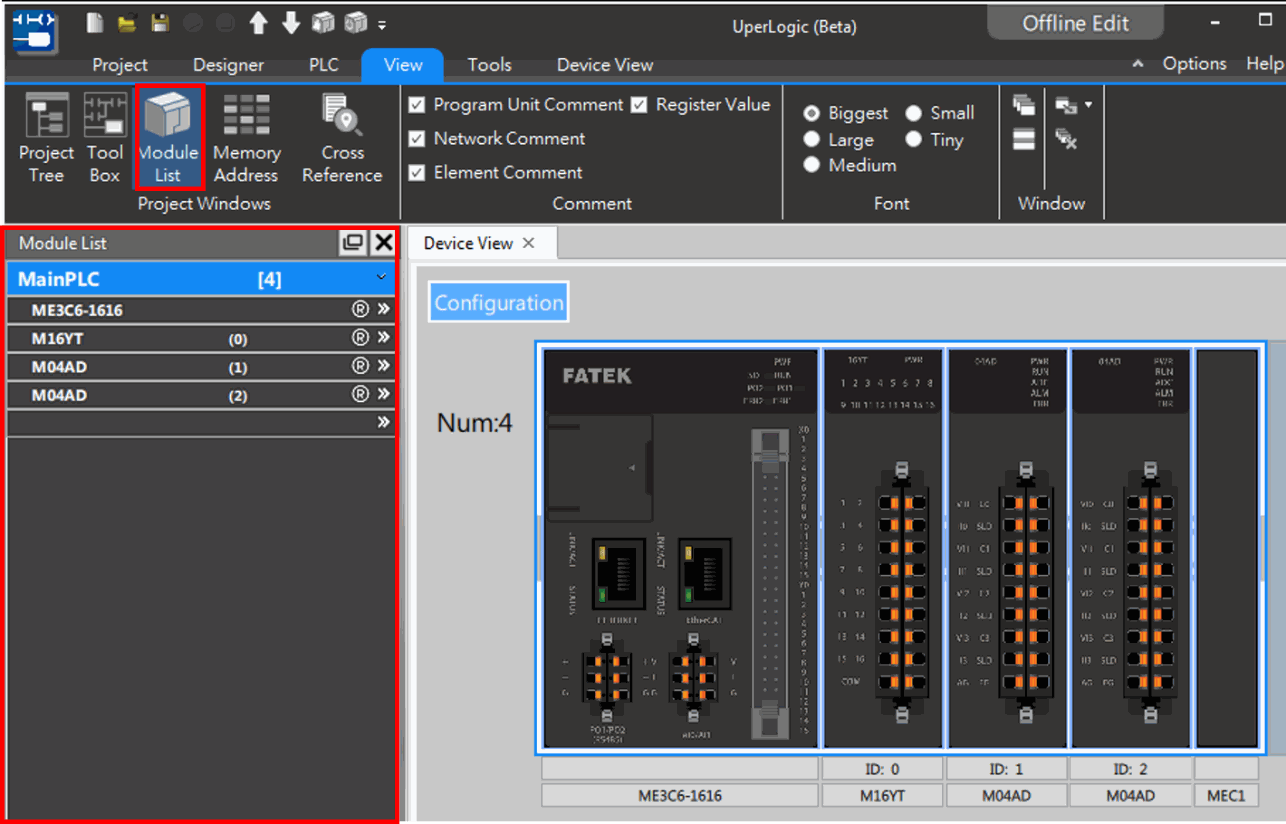
Fig. 215: Module List
The module list will display the module currently installed. When clicking the corresponding module, the module list will also display the module currently selected.
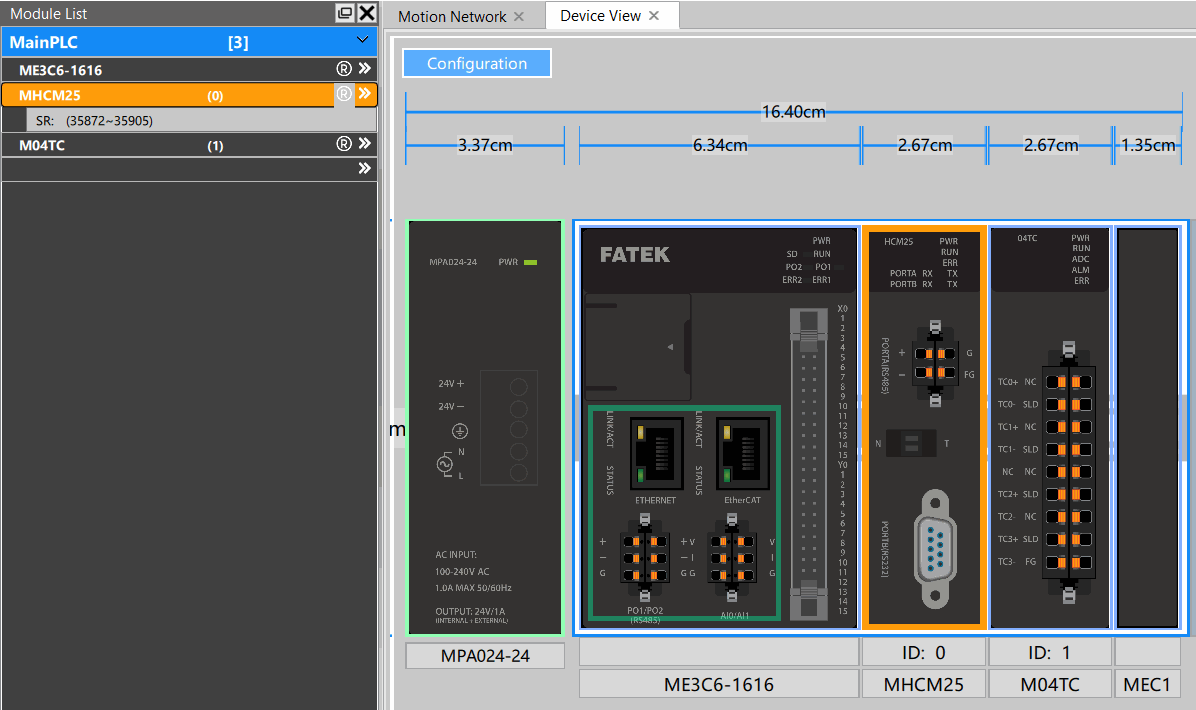
Fig. 216: Selecting module
Click the module in the Module List, and it will show the resource consuming status of the corresponding module.
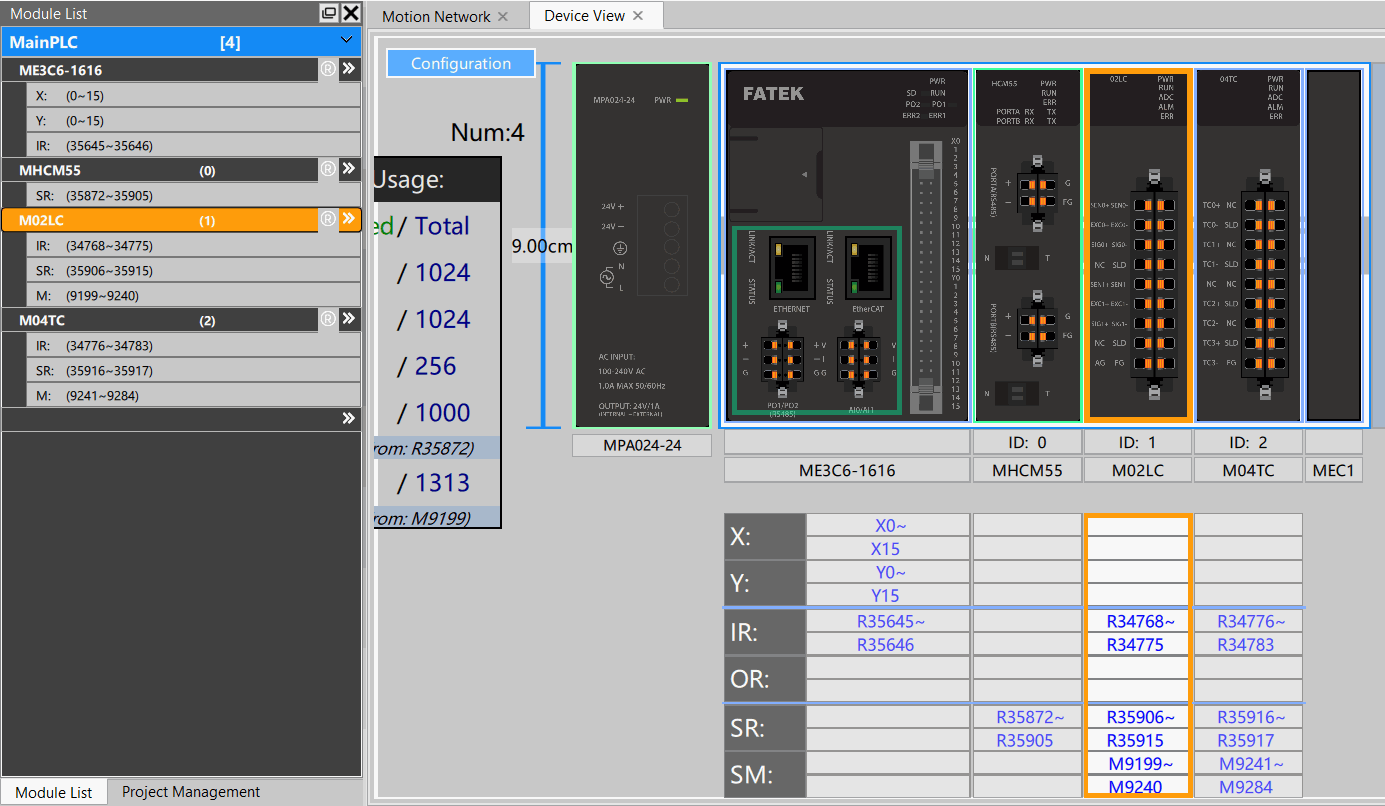
Fig. 217: Module resources in Module List
Based on the sequential order, the Module List will show the name, ID,  and
 of the module or PLC.
[ ]: To expand or compress the resources items of such module.
[ ]: It allows the user to skip to equipment window directly from other page and the system will also mark the selected module automatically.
10-3 Device Monitor
Click [Project] → [Device View] → [Device Monitor] in function toolbar, and the system will show the right-side device monitoring window:
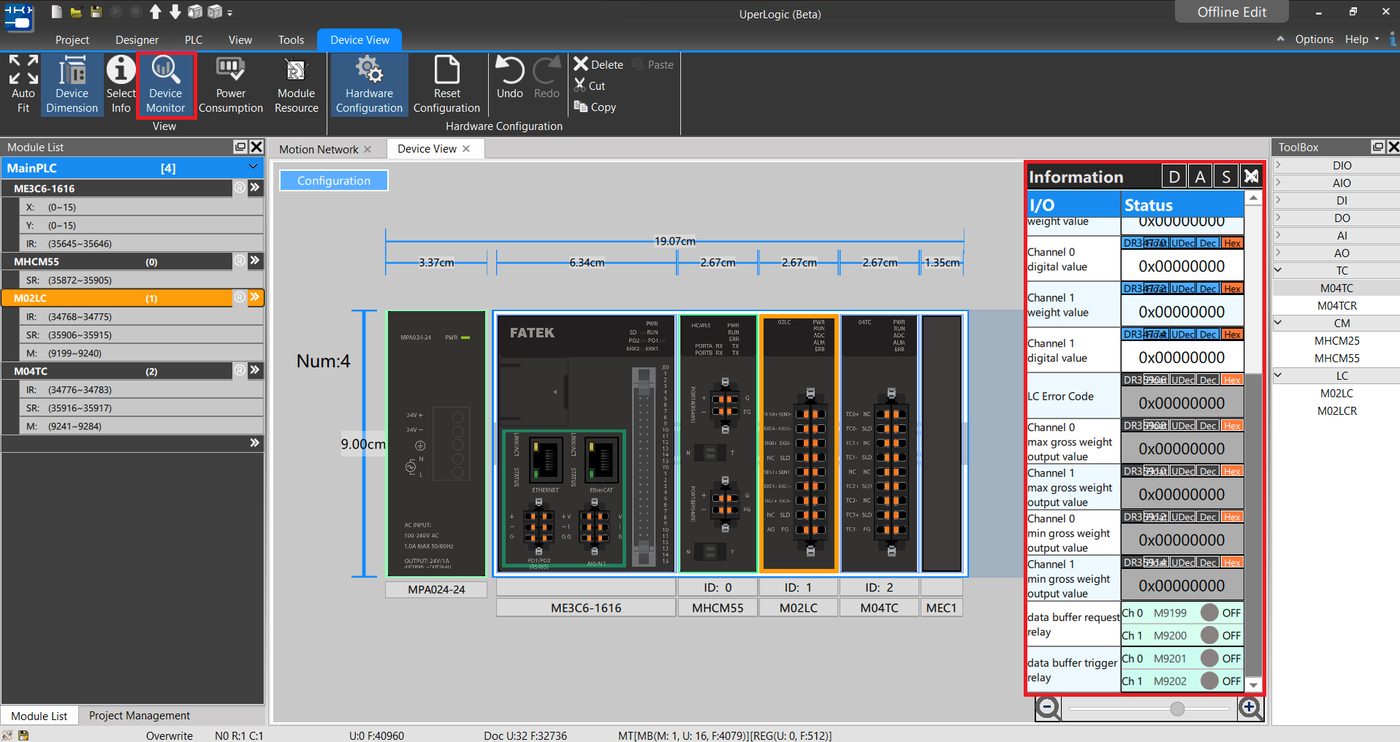
Fig. 218: Device monitoring
In the information, you may select the resource that will be displayed such as “Digital Data,” “Logic Data,” “Status Data” and “Relay.”
10-3-1 Digital Data
When clicking [Digital Data] above [Device Monitor], the Module List will show digital data only. Next, point the mouse at the target value. When the switch is shown in blue as per the figure below, it means the user will be allowed to change the switch of such register.
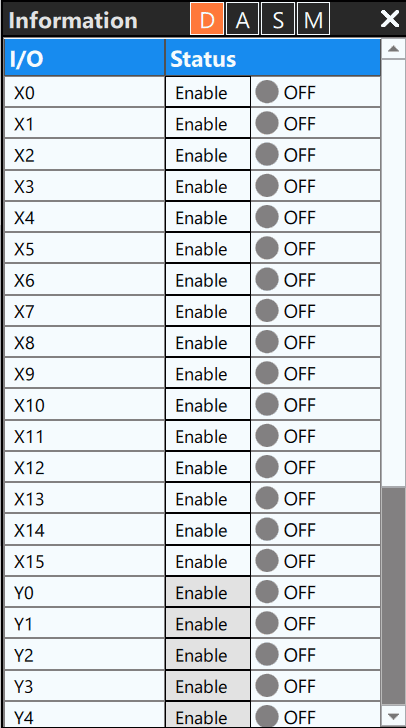
Fig. 219: Digital data of device monitoring
10-3-2 Logic Data
When clicking [Logic Data] of the information above [Device Monitor], the Module List will show logic data only. Next, point the mouse at the target value. When the data is shown in blue as per the figure below, it means the user will be allowed to change the switch of such register. In the meantime, it also allows the user to quickly change the value displaying pattern with [Dec] and [Hex] on the right side of the register.
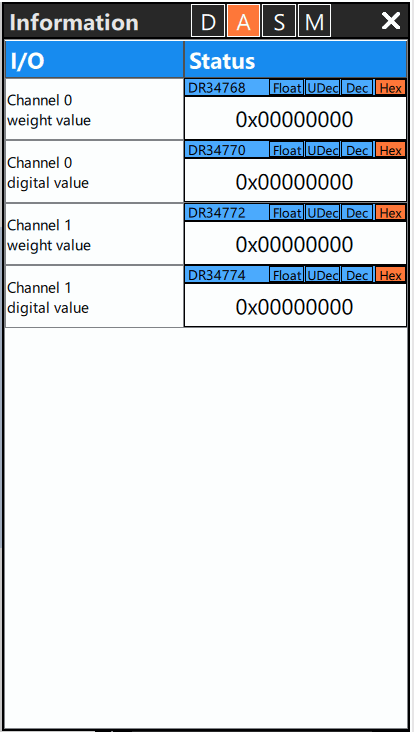
Fig. 220: Related logic data of device monitoring
10-3-3 Status Data
When clicking [Status Data] above [Device Monitor], the Module List will show status data only. If the data is shown in gray as per the figure below, it means the user will not be allowed to change the value of such register. However, the user is still allowed to instantly change the value displaying pattern with [Dec] and [Hex] on the right side of the register.
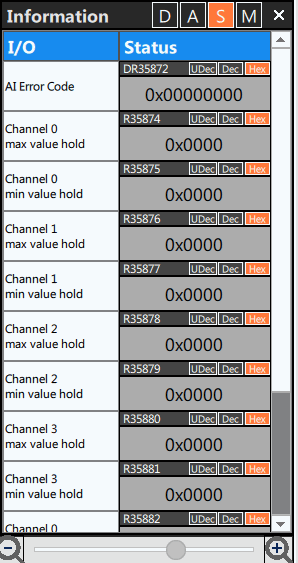
Fig. 221: Status data of device monitoring
10-3-4 Relay
When clicking [Relay] above [Device Monitor], the Module List will show status data only. Next, point the mouse at such value. If the data is shown in blue as per the figure, it means the user will be allowed to change the value of such register; otherwise, it will be impossible to make the change if the register field is shown in gray background.
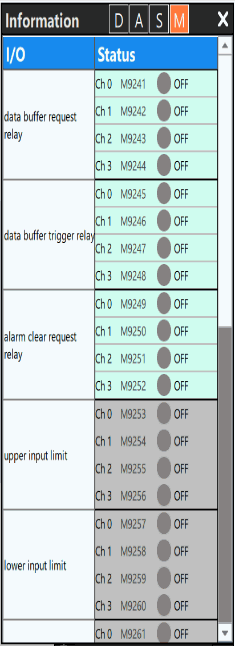
Fig. 222: Status data of device monitoring
10-4 Power Consumption
Click [Device View] → [Power Consumption] in function toolbar, the lower-right side will show the power consumption calculation window, as per the figure below:
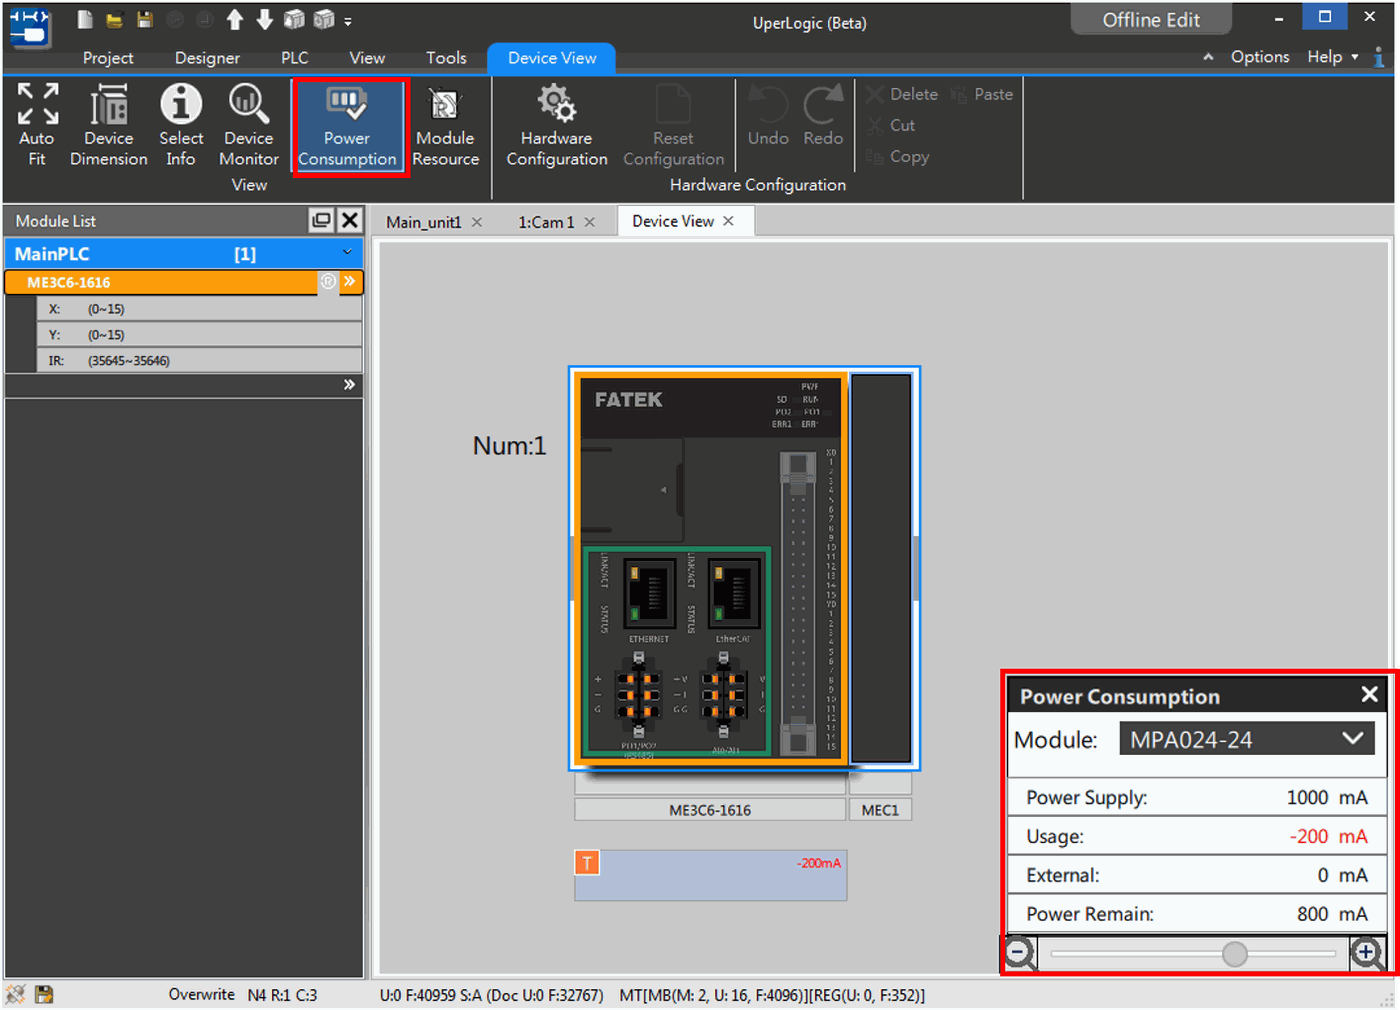
Fig. 223: Power Consumption
|
Function |
Description |
|
Module |
Select the power module that will be used now. |
|
Power Supply |
The power capacity supplied by the power module. |
|
Usage |
Display the total power capacity consumed by all modules currently used. |
|
External |
Display the total power capacity supplied by external power source as estimated by the user. |
|
Power Remain |
Remaining power capacity after deducting the supplied capacity from the power module. |
Table 26: Introduction of detailed power consumption
Additional power will be required for certain modules such as M04DA indicated in the figure. The user may determine if using the power supplied by the host or by the external source. If external power supply will be required, click  and set such power as external power supply and then recalculate the capacity currently required, as per the figure below:
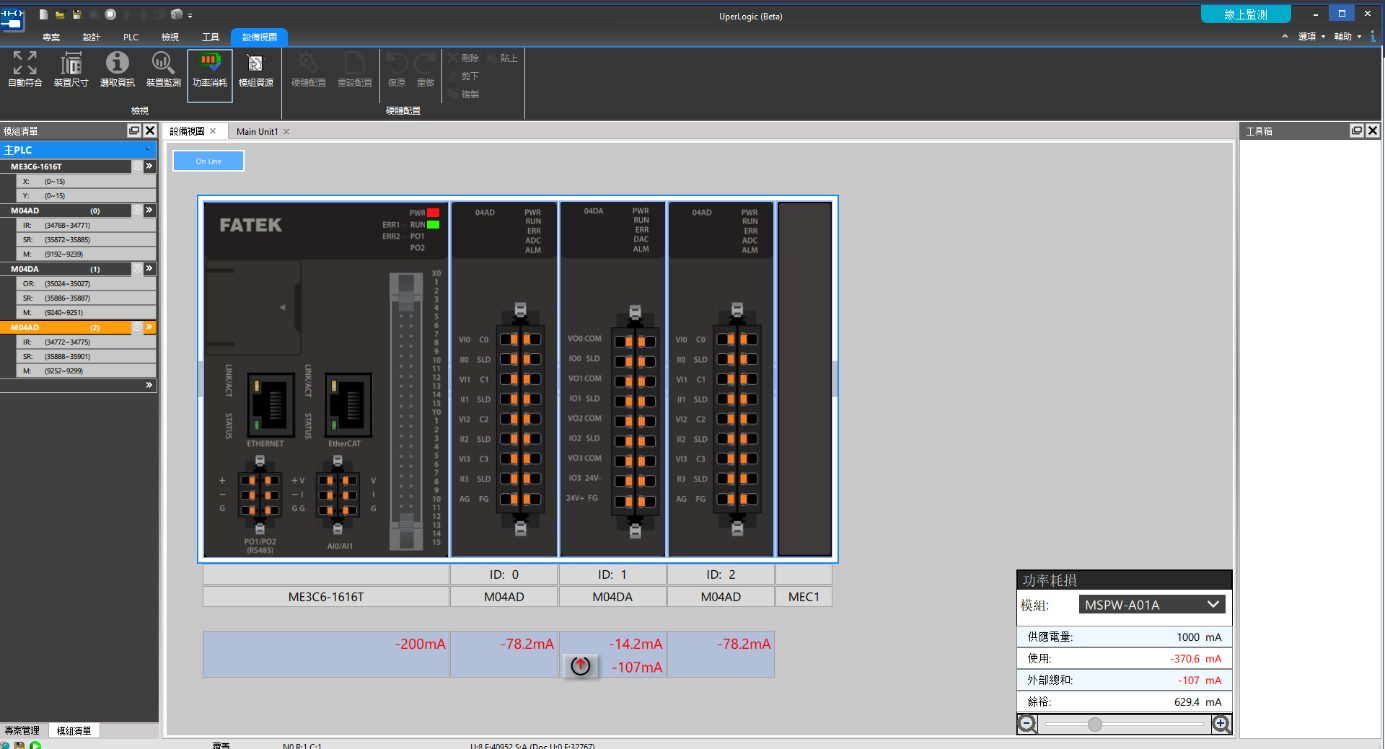
Fig. 224: External power supply
10-5 Module Setting
Double clicking the expansion component with the left mouse button and the corresponding module setting window will pop up. In addition to creating the equipment name and comment, the user is also allowed to set up the module parameters in “Offline Edit” and to calibrate the corresponding module in “Online Monitor.”
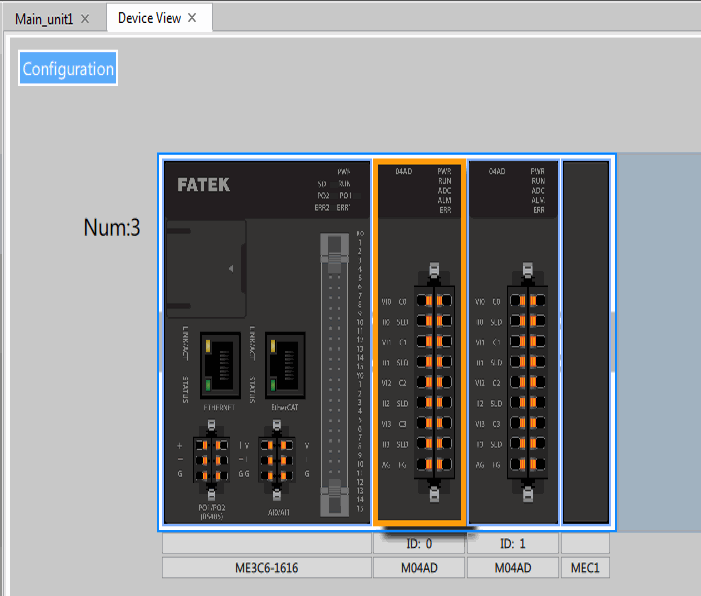
Fig. 225: Setting the module
Although the equipment information of each module may vary in name and description, however same information will be displayed. Indicated below is the introduction of the equipment information related content by using M04TC as the example.
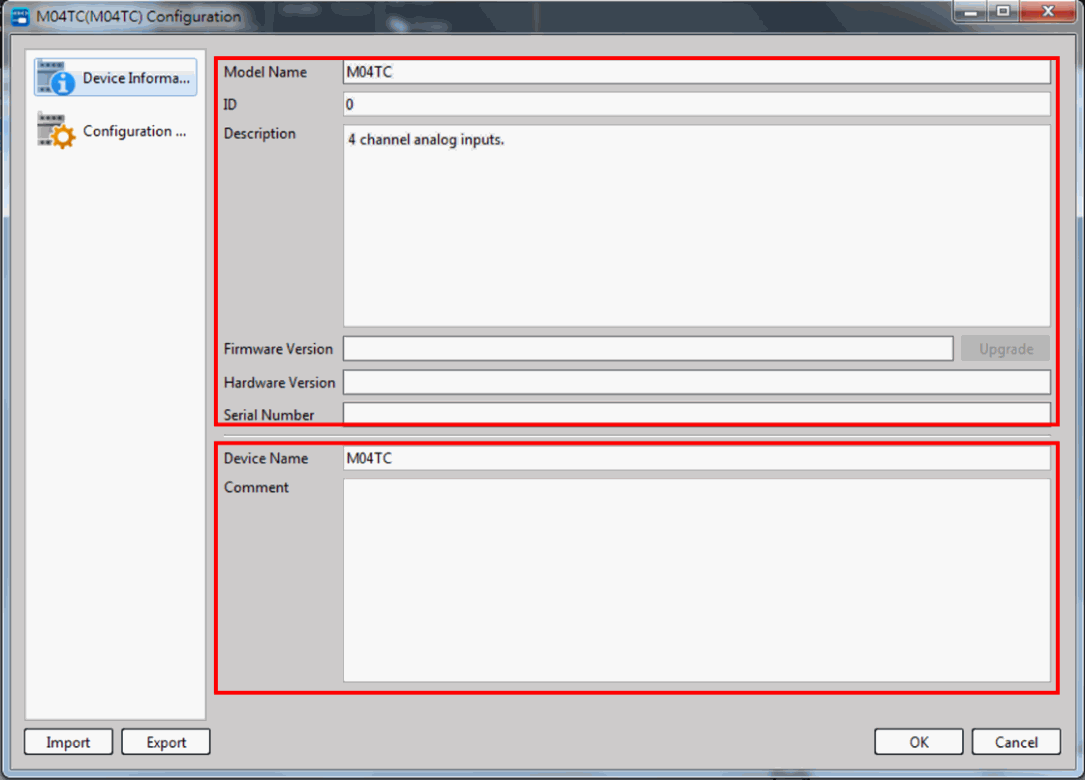
Fig. 226: Device information (M04TC)
|
Information |
Description |
|
Module name |
The name of the module. It is the default value and cannot be edited. |
|
ID |
Display present number of the module automatically according to the sequence of the string devices. |
|
Description |
The functional description of the module. It is A default value and cannot be edited. |
|
Firmware Version |
By clicking the right-side [Upgrade] button, you may upgrade the firmware of all modules installed in the PLC and such function will be active only under “Online Monitor.”
|
|
Hardware Version |
Present hardware version of the module. It is a default value that cannot be edited. |
|
Serial Number |
Present serial number of the module. It is a default value that cannot be edited. |
|
Device Name |
The user may define the equipment name and then save the changed information in the Project. |
|
Comment |
The user may define its own comment and then save the changed information in the Project. |
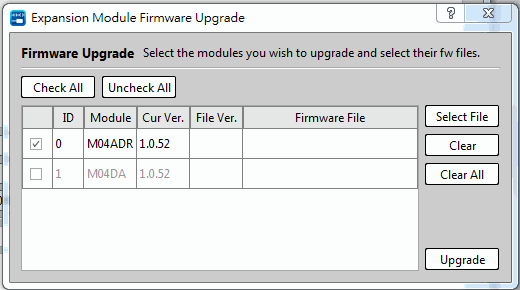
Table 27: Device Information List
After changing the device name, press [OK] and the changed name will be displayed under such device.
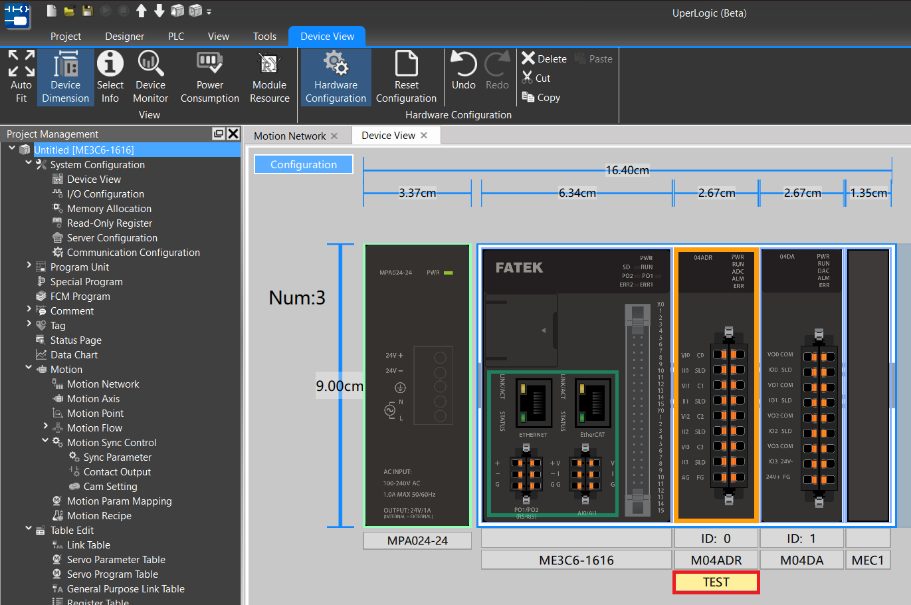
Fig. 227: Changed module name
Each module will be configured to display the content of the corresponding parameters. Provided below is the introduction on how to execute the configuration by using M04TC as the example.
When operated under “Offline Edit,” the user may emable or disable the corresponding channel and change the desired parameter. Please refer to the relevant manuals.
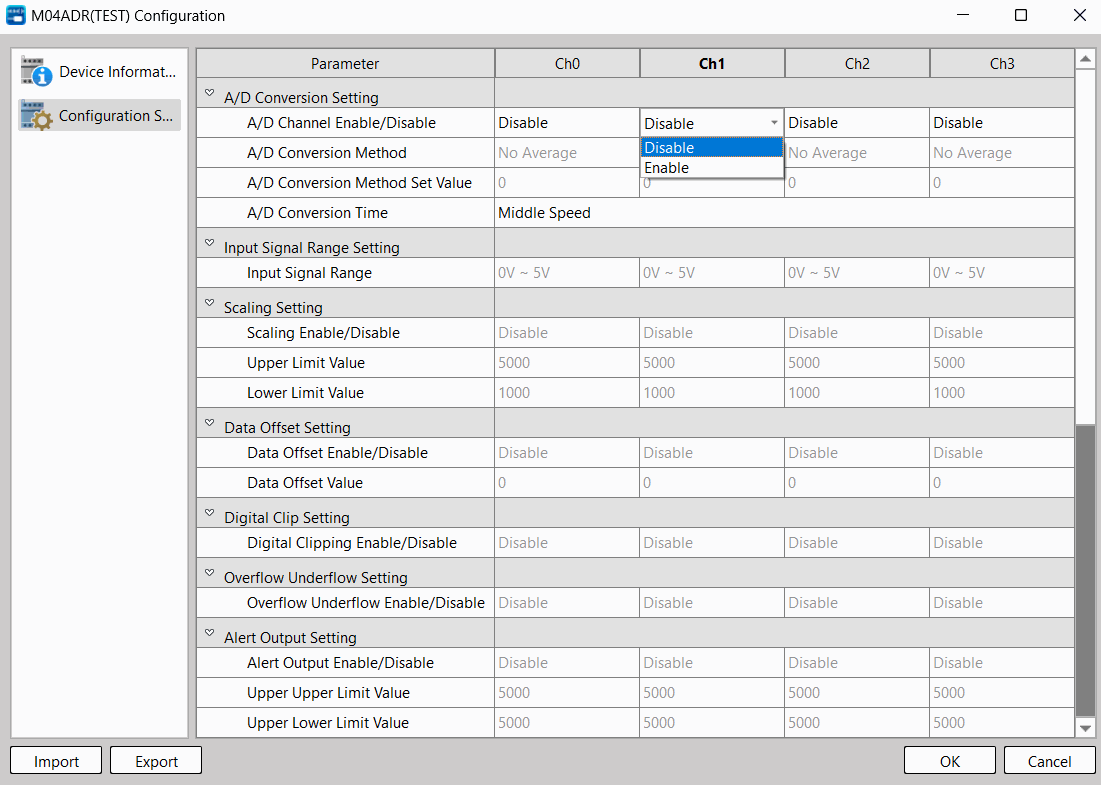
Fig. 228: Configuration information_offline edit (M04TC)
When the CM Module is under “Office Edit,” it allows the user to set up the packet or the table for the corresponding mode. Provided below is the introduction by using MHCM55 as the example.
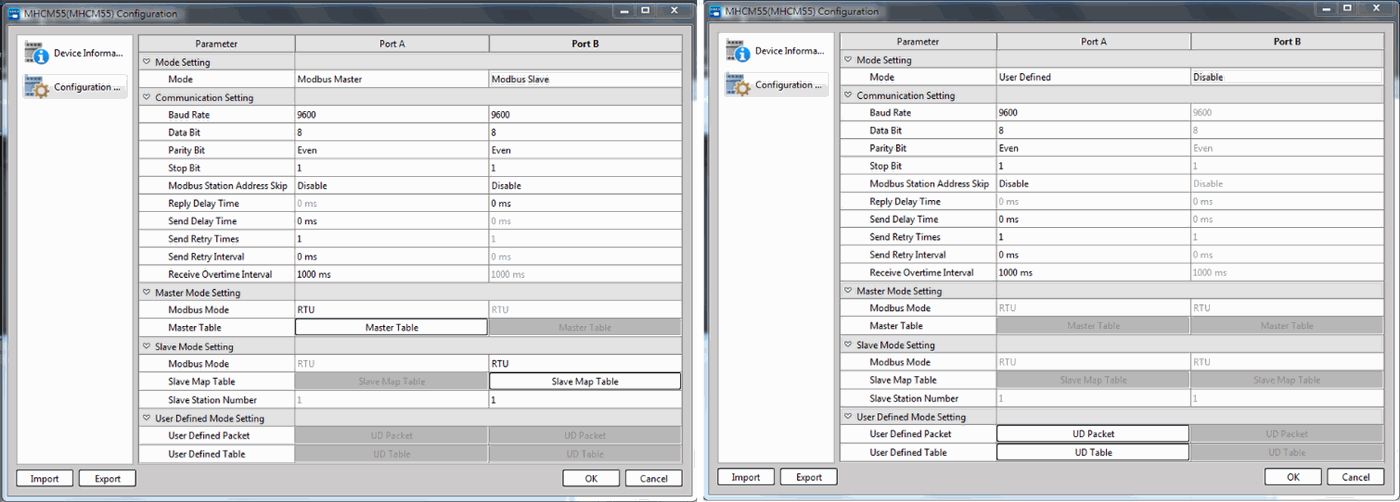
Fig. 229: Setting parameters for communication module (MHCM55)
Modbus Master Station
After selecting the Modbus Master Station, it allows the user to create the table for the Master Station.
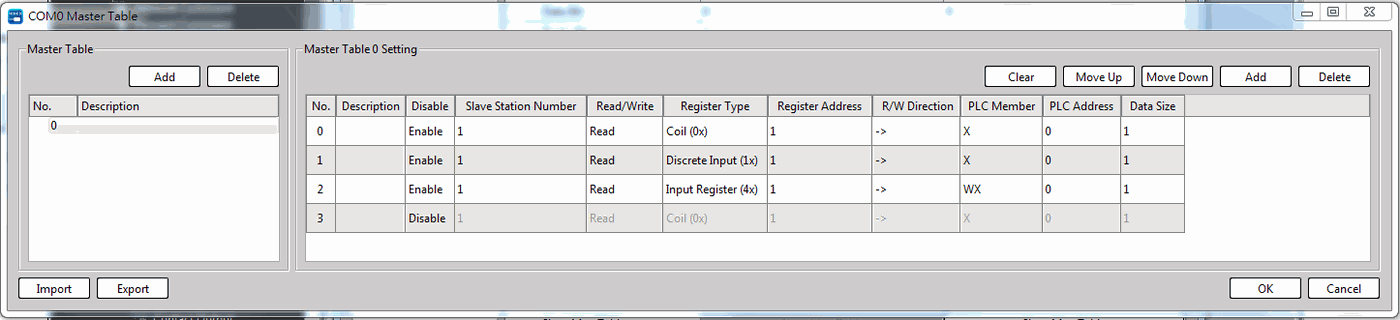
Fig. 230: Setting Master Station Table
In the left-side Master Station Table, the user will be allowed to Add (+) or Delete (-) the table and then create its own description for easier identification. After adding the table, the user may add new order in the right-side Master Station Table and then click the corresponding parameter to proceed with the change.
Please refer to the relevant manual for details about setting parameters in the table of the master station.
Modbus Slave Station
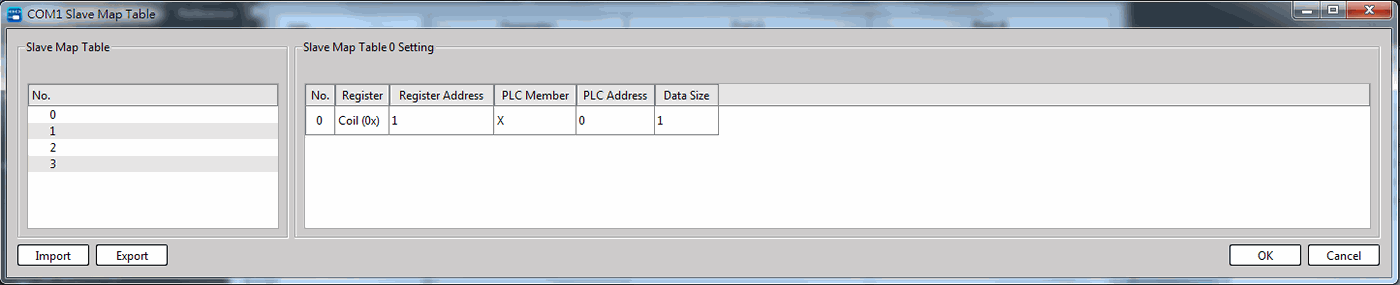
Fig. 231: Setting Slave Station Table
In the left-side Slave Station Table, select the number that will be edited. After that, you may start setting up the corresponding parameters in the right-side Slave Station Table.
Please refer to the relevant manual for details about setting parameters in the table of the slave station.
User Defined Value
The user defined value comprises two tables and they are User Defined Packet and User Defined Table.
User Defined Packet
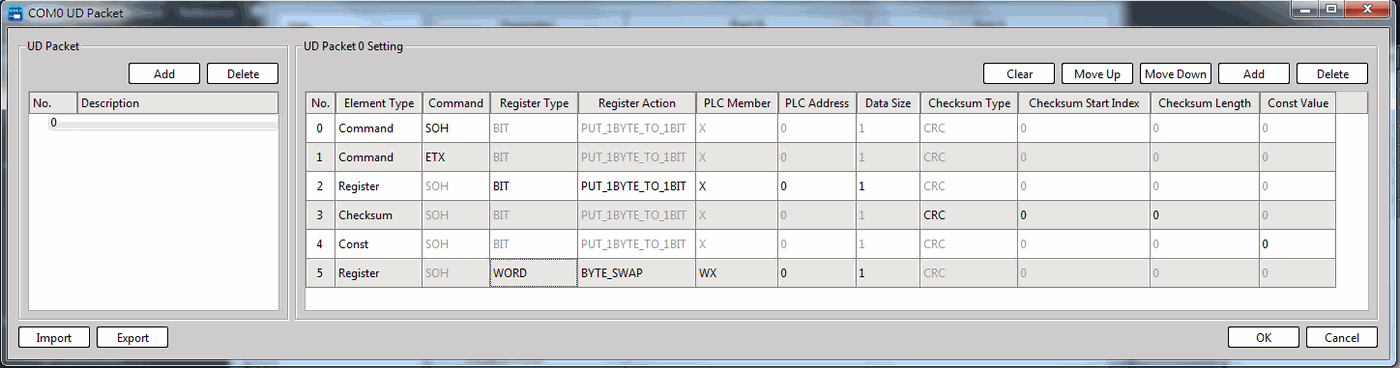
Fig. 232: Setting User Defined Packet
In the left-side User Defined Packet, the user will be allowed to Add (+) or Delete (-) the packet and then create its own description for easier identification. After adding the packet, the user may add new command in the right-side UserDefined Packet and then click the corresponding parameter to proceed with the change.
Please refer to “ Function and Application User Manual ” for details about setting parameters in Use Defined Packet.
User Defined Table
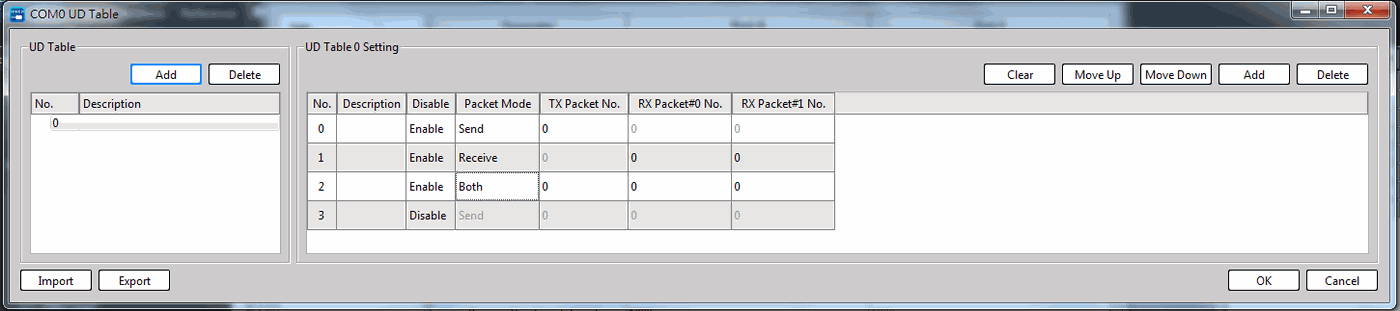
Fig. 233: Setting User Defined Table
In the left-side User Defined Table, the user will be allowed to Add (+) or Delete (-) the table and create its own description for easier identification. After adding the table, the user may add new command in the right-side User Defined Table and then click the corresponding parameter to proceed with the change.
Please refer to the relevant manual for details about setting parameters in User Defined Table.
When operated under “Online Monitor,” the AI, AO, TC and LC modules will be provided with calibration function. Provided below is the introduction by using M04TC as the example.
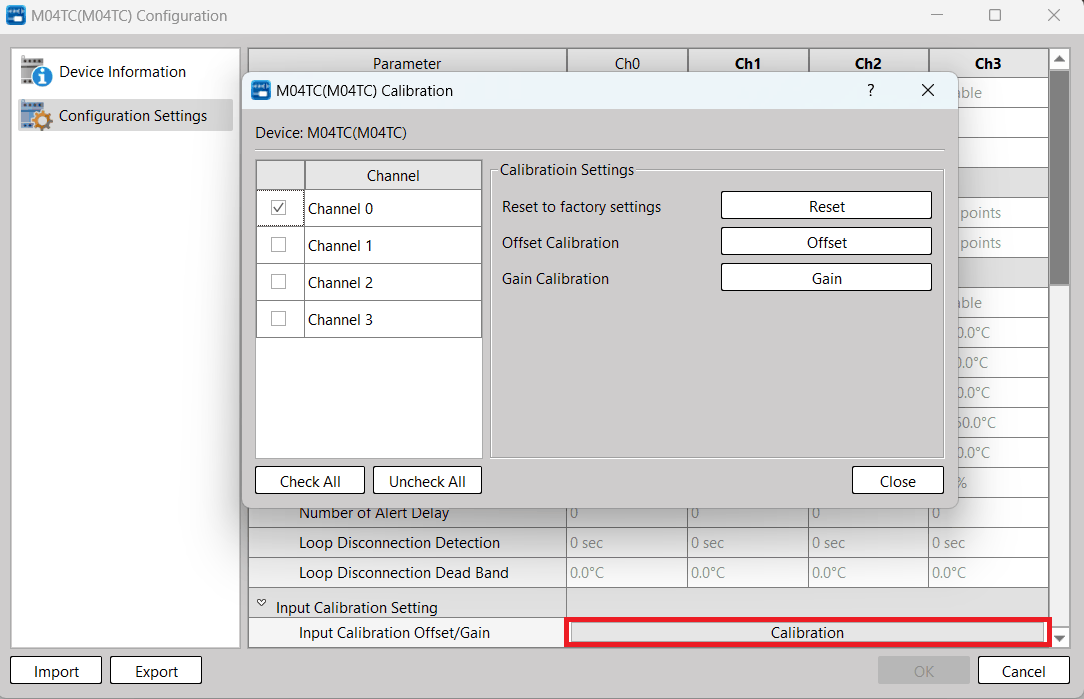
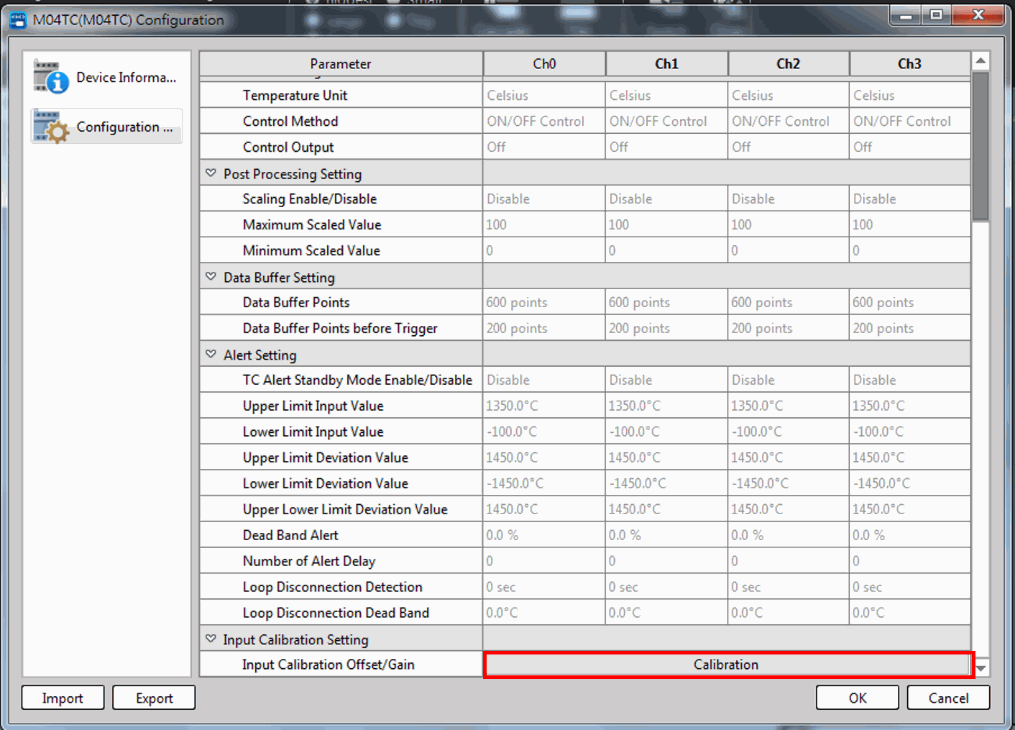
Fig. 234: Module calibration_Online monitor (M04TC)
Click [Calibration] at lower-middle of [Configuration Setting] column, and you can open the calibration window for the corresponding module. First, select the left-side channel that will be calibrated. Next, select the required setting procedure in calibration setting and then you may complete the calibration according to the corresponding steps.
The lower-left side of the module is configured with the export and import options for users to quickly export and import the edited setting result.
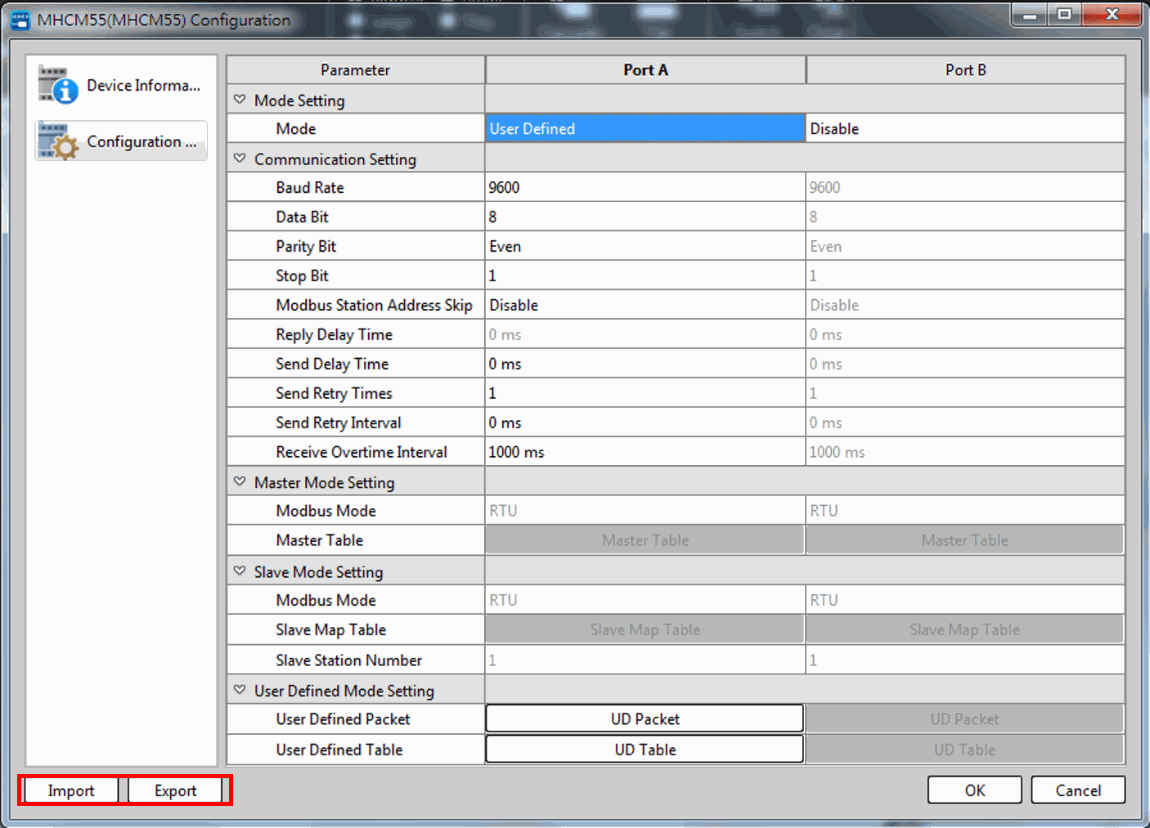
Fig. 235: Export and import of module setting
It should be noted that the file exported by the CM Module from different setting pages shall not be applicable for other purposes. As indicated in the figure below, the file exporting and importing function of the module cannot be used for exporting or importing the User Defined Packet.
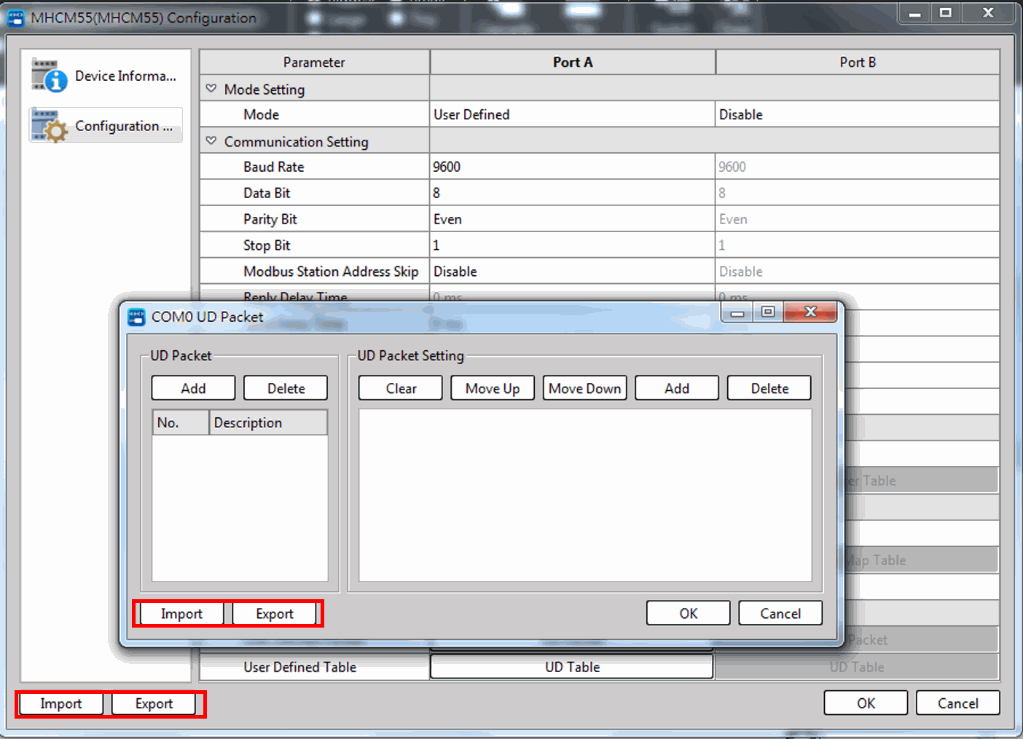
Fig. 236: Incompatible exporting and importing
Copy and Paste
In [Configuration], move the cursor to [Channel] and then click the right mouse button and you will be allowed to execute the copy, paste and reset functions.
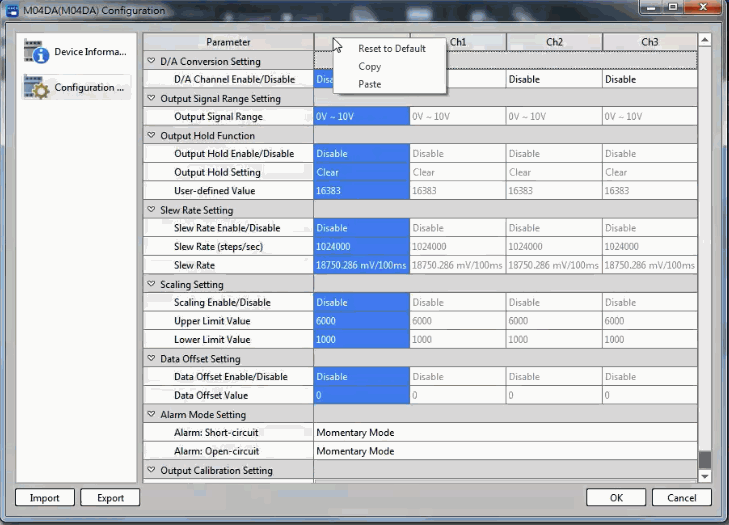
Fig. 237: Channel’s right mouse button function
|
Function |
Description |
|
Reset to Default |
Restore all of the channel settings to initial preset value. |
|
Copy |
Copy all settings of the channels currently selected. |
|
Paste |
Paste previously copied channel settings. |
10-6 I/O Configuration Status
UperLogic adopts the automatic detection mode for the expansion unit. After connecting with the host, UperLogic will automatically read the status of the host and the expansion unit, and at the same time automatically allocate the occupied system resources.
Users can see how many expansion units are connected to the host in [Project] → [Device View], and which system resources are occupied by the expansion modules.
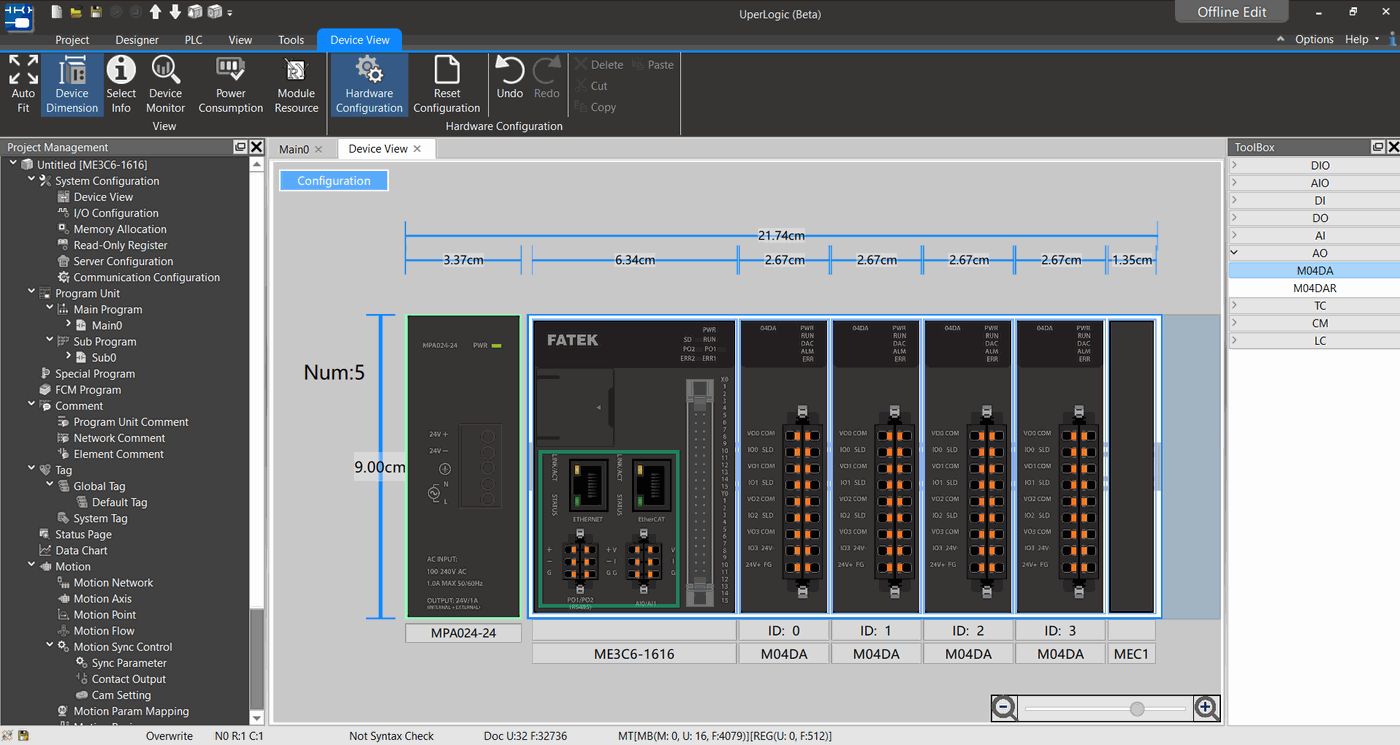
Fig. 238: Device management window
To view the configuration status of the I/O numbering, just click [Device View] → [Device Monitor], and then click the relevant module in the working window, and relevant information such as Digital/Analog/Status will be displayed on the right side, which is convenient for users to monitor the reading values and status of each IO more intuitively, as shown in the figure below:
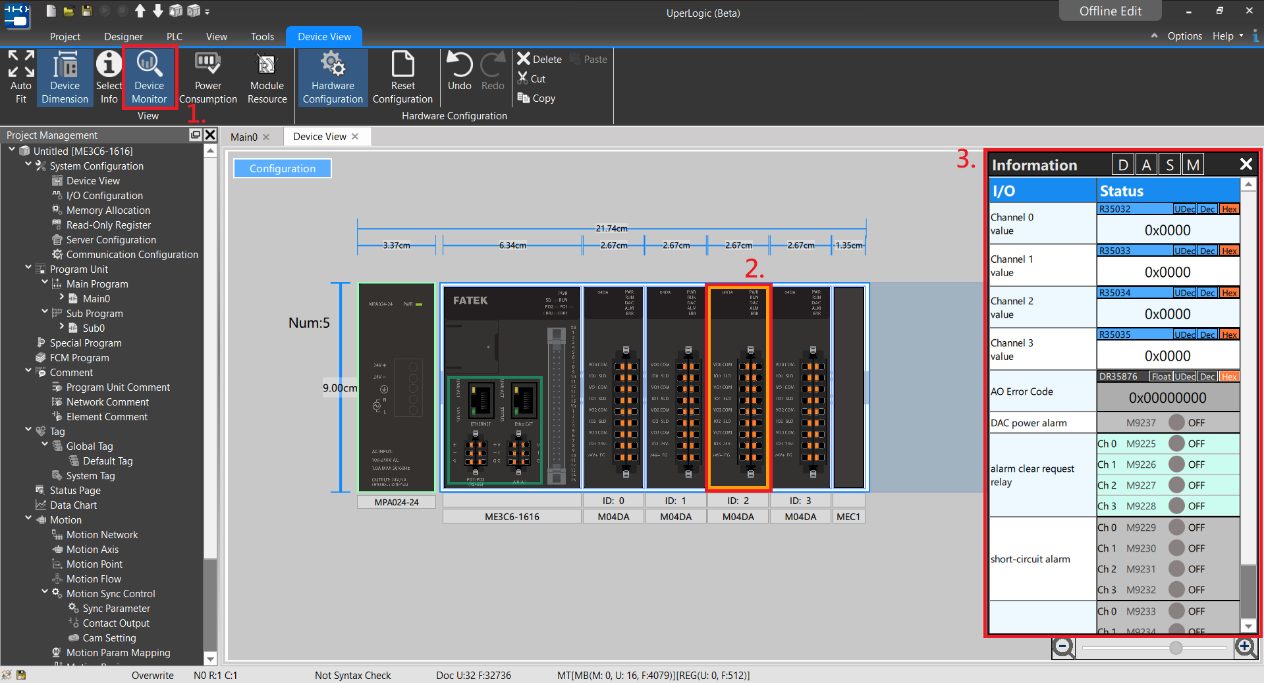
Fig. 239: The right-side display information such as Digital/Analog/Status
Tip: press ← → to switch chapters, Ctrl+K to search