|
⚠Danger |
|
This section describes the method of applying user-friendly interface as well as convenient operation and orderly-arranged pages to execute the required monitoring management for the designed functions such as toolbar, project window, status monitoring page and ladder window, etc. The purpose is to provide more convenient operation and well-defined window pages. Introduced below is the respective monitoring operation method.
12-1 Displaying Ladder Diagram Status
For detailed operation procedure, please refer to Section 7.2: “Ladder Diagram.”
12-1-1 Monitoring and Debugging
- Save the imported program in the PLC and then click [File] → [Save Project As] → [Save to PLC] in function toolbar. Next, the system will execute the online connection through the created “Online Parameter.” After connecting, the window will appear as below:
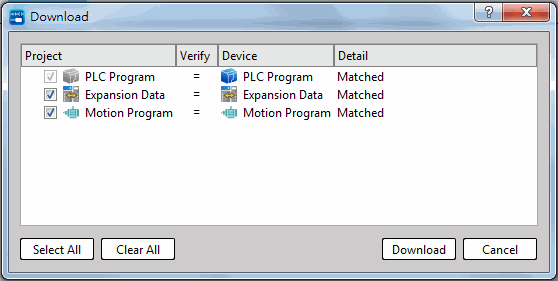
Fig. 258: Download setting
If the “Online Parameter” is configured incorrectly or if the online is faulty, then the window will display the corresponding error message.
- After completing the download, click [Online Monitor]. After that, click [PLC] → [Run PLC] in function toolbar; or you may input “F9” quick key to instruct the PLC to start running the program. In the meantime, you may also click [PLC] → [Stop Run] in function toolbar.
You may also click “Ctrl” + “F9” quick keys to instruct the PLC to stop running the program. - When running the PLC, the ladder program window will change to the following status:
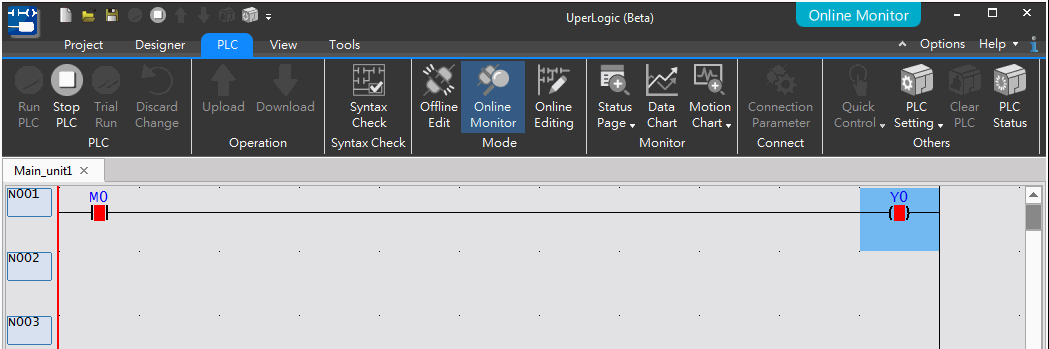
Fig. 259: Running PLC ladder program
The element indicated in the solid line block means it is under conducting state. At this time, you will be allowed to control the ladder program display in order to show the program comment or present Register value in the window page.
The displayed content in the ladder window comprises the following options:
- Program Unit Comment
- Network Comment
- Element Comment
- Register Value
- Font Size
The more the selected options, the more the displayed information; however, less program codes will be covered by the same screen space.
Clicking [View] in function toolbar with mouse and the tick-type menu will appear for selecting the desired option. Such menu will show the aforesaid options and then the user will be allowed to select the desired option by clicking steps. At this time, a tick symbol will appear on the left side of the selected item. Tick again, and this item will return to the unselected status.
Indicated below is the result after ticking [Element Comment] and [Single Network Comment]:
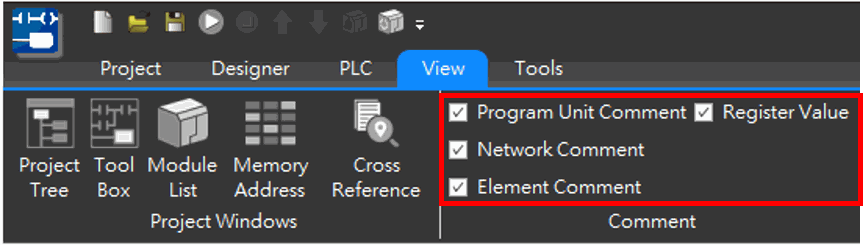
Fig. 260: Displaying the comment
As per the figure below, the ticked comment will appear in the comment field after being selected.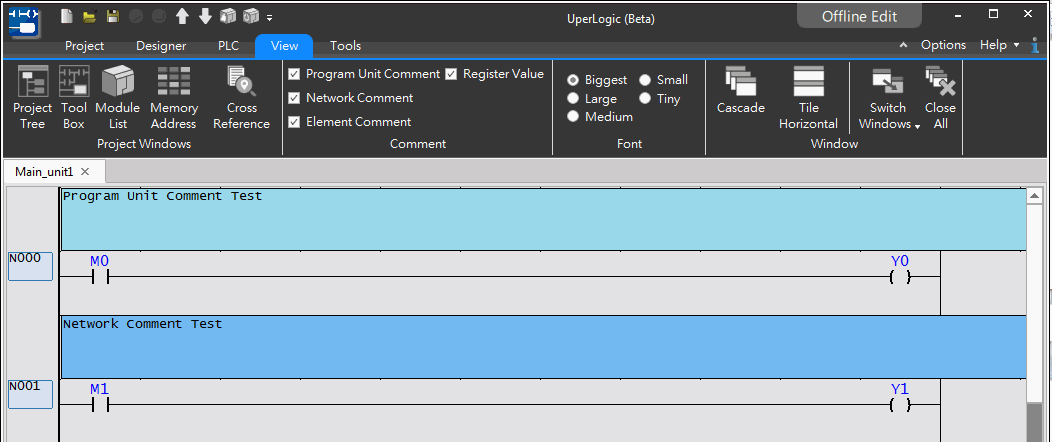
Fig. 261: Displayed in comment field
Coil enable/disable control:
After completing the “RUN” process, move the cursor to the coil position and then press the right mouse button to show the menu as below:
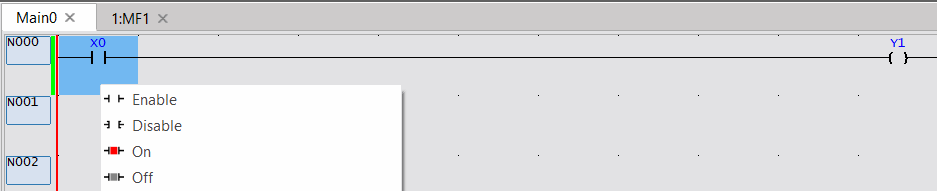
Fig. 262: Coil enable/disable control
With “Disable” function, the user will be allowed to remove the component from the program control. For example, when “X0” is disabled, its status will not be changed by “X0” status. At this time, you may control its status by clicking [ON] and [OFF] and the disabled element will be indicated in the respective type of symbol. Provided below are the symbols display for “X0” of the “disabled” element:

Fig. 263: Disabling the elememt
- You will be allowed to start the test with [Status Page]. By doing so, open an empty status monitoring page according to the following procedure:
Cclick [Project] → [Status Page] → [New Status Page] in function toolbar. You may also double click the icon in project management window with mouse or click the toolbar icon with mouse and then click [New Status Page].
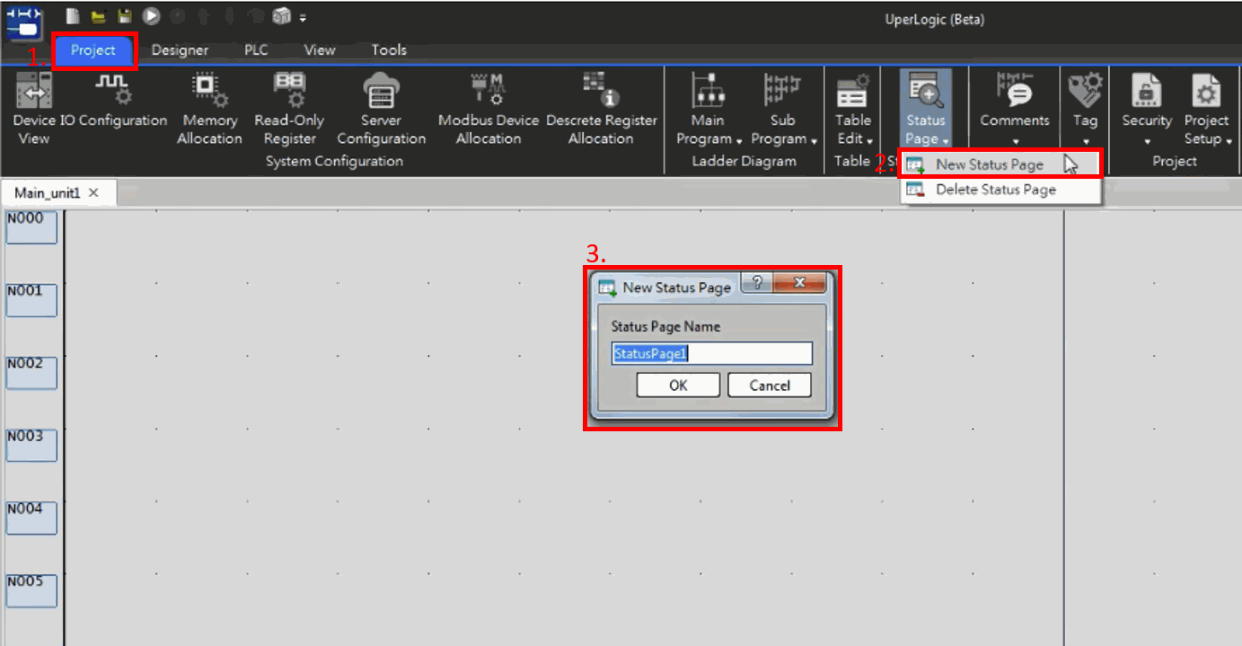
Fig. 264: New Status Page
The dialog box will be displayed after completing the aforesaid procedure. In [Status Page Name], import “StatusPage1” and then press [Enter] key to show the window as below:
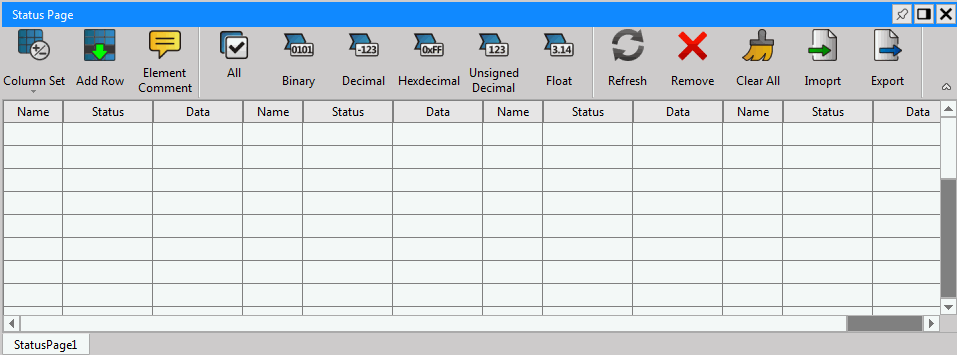
Fig. 265: Status Page
How to add Status Page?
To execute, move the mouse cursor to the first empty space in the leftmost [Name] column and then import “y0-7.”
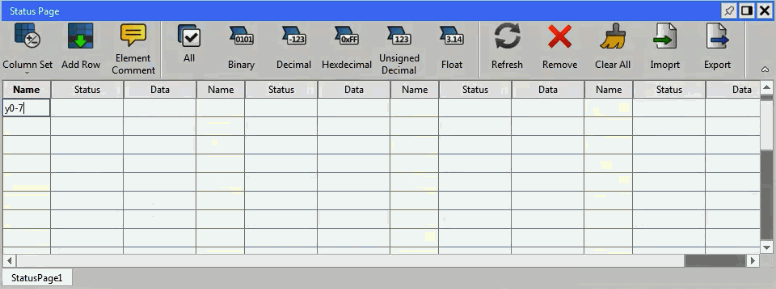
Fig. 266: Adding Status Page
Press [Enter] key. After that, the window will show the number of Y0–Y7 together with the enable/disable and ON/OFF status as well as the present value of the information.
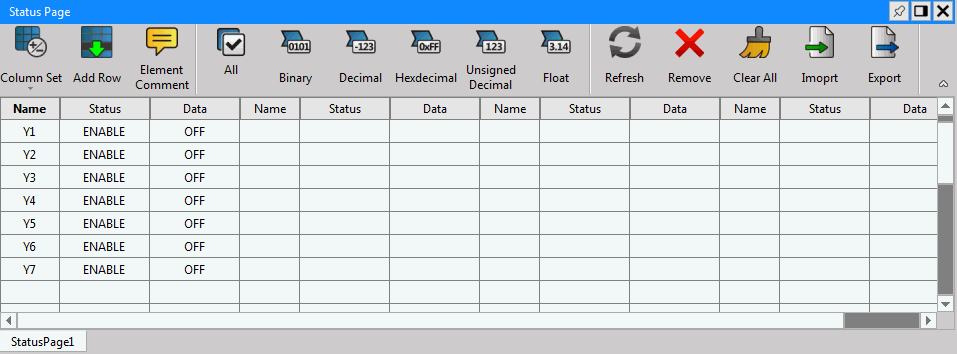
Fig. 267: Monitoring status of Status Page
How to execute Enable/Disable?
To enable/disable the contact or the coil, move the cursor to the corresponding [Status] column and then double clicking the mouse to show enable/disable option. To set its value, move the cursor to the corresponding Information column and then import “0” and “1” values or double clicking the left mouse button to open the [Value Input] column.
As far as the Register is concerned, the [Status] column can be used to control its display format. Currently, the software is provided with five kinds of display formats and they are systems of [Decimal], [Unsigned Decimal], [Binary], [Hexadecimal] and [Float]. To select the desired system, double clicking the [Status] column with the left mouse button to call out the menu. In addition to displaying the element number, the [Number] column can also display the number through the element comment. To execute, press the right mouse button in [Status Page] to call out the pop-up menu or click [Comments] at the top.
12-2 Status Page
12-2-1 Status page management
Click [Project] → [Status Page] in function toolbar and then select “StatusPage1” that already exists in the [Status Page Name] column. In project management window, you may also click [Comment Description → [Status Page] and then select “StatusPage0” that already exists in the [Status Page Name] column and then the [Status Page] window will appear. All of the existing monitoring names are listed in the widow tab. By clicking such tab, you may switch to the selected tab option and then click [X] icon at upper-right corner to close [Status Page] window.
12-2-2 Operating the monitor point
Definition of monitor point:
In [Status Page], you can double-click the [Name] column with the left button of the mouse to enter a number, such as R1000, indicating that the monitoring point is R1000; or input a range, such as D0-D4, indicating the range of monitoring D0 to D4.

Fig. 268: Definition of monitor point
Deleting the monitor point:
Click the number to be deleted with the cursor and then press [Delete] key and the selected number will be deleted. To delete all points, press [Clear all].
|
Function |
Description |
|
Column Set |
Users can display 1-4 field groups according to their own needs. |
|
Insert After {Add Row} |
Insert a column below the selected field. |
|
Insert Above (Add Row) |
Insert a column above the selected field. |
|
Element Comment |
Choose whether to show annotations. |
|
All |
Click and then choose the data type (binary, decimal…), the data on the page will all be displayed as the same data type. |
|
Binary |
Display data in binary |
|
Decimal |
Display data in decimal |
|
Hexdecimal |
Display data in hexdecimal |
|
Unsigned Decimal |
Display data in unsigned decimal |
|
Float |
Display data in float point |
|
Refresh |
Get the latest information on the elements on the page |
|
Remove Row |
Delete the selected row |
|
Delete Content |
Delete the selected data |
|
Clear All |
Delete all of the data on the page |
|
Import |
Import the previous status page data |
|
Export |
Export the current status page data |
12-2-3 Data Chart
Through the data chart, the Register data can be displayed on the curve graph more intuitively at the same time, which is convenient for users to compare.
Click the function bar [PLC] → [Data Chart], click [Project Settings] to select the Register to be viewed, and then click [Start], the data of the Register will be displayed in a line chart.
On the control panel at the upper right of the data chart, operations such as zooming in and zooming out the data chart can be performed; the upper left is the sampling interval, which users can set according to their own needs; the list at the bottom left displays the registers currently being viewed. Check [Hide] to temporarily hide the data chart of the Register.
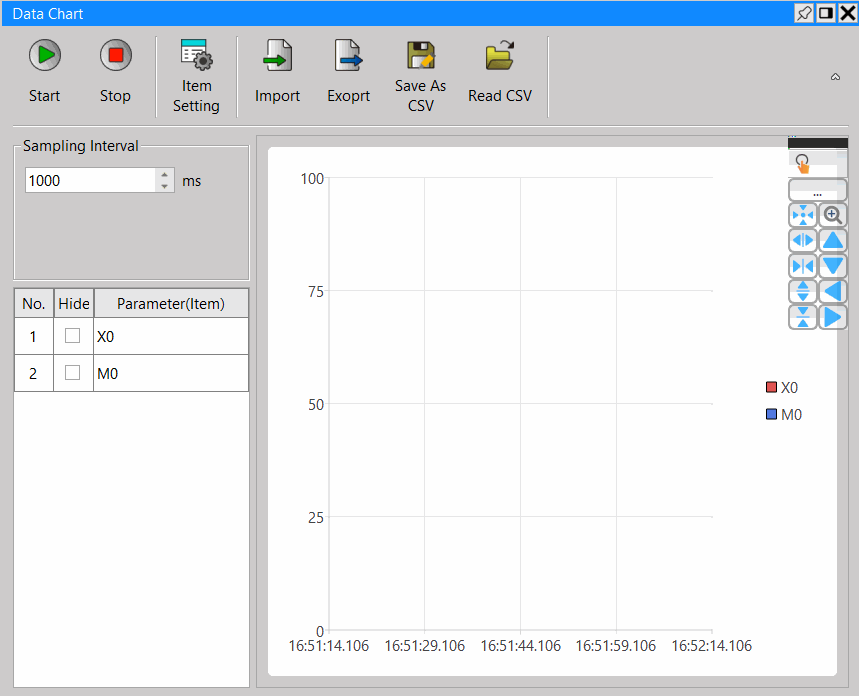
Fig. 269: Data Chart
|
Function |
Description |
|---|---|
|
Start |
Start monitoring the configured Register |
|
Stop |
Stop monitoring the configured Register |
|
Item Setting |
Set the Register position to be monitored |
|
Import |
Import the previous data chart |
|
Export |
Export the currently written data chart |
12-3 Element Memory
12-3-1 Introduce
Element Memory refers to the function of writing and reading values to and from PLC components. By using the function to read element memory, users can check the status of the PLC’s element memory and the difference between the current element values, which helps in debugging. Additionally, by writing to the element memory, users can batch change the current values of PLC elements, making it convenient for project designers to maintain and manage equipment data.
Usage context
- Debugging
After the project is downloaded to the PLC and running, users can back up the current element values by using the element memory upload function . Once a runtime error occurs, the element memory’s monitoring function can be used to search for differences between the project and the current values, facilitating debugging.
- Bulk writing
Users can set multiple sets of element memory in the project to download specific element values for different scenarios. This method can also be used to clear specific registers without clearing all registers or coils each time.
12-3-2 Function Operation
You can create a new component memory editing document by [ Project Management ] on the left side → [ Element Memory ] → right-click [ Add Element Memory ] or from the top toolbar [ Project ] → [Element Memory ] → [ Add Element Memory ]. Currently, each project can set up to 5 groups of element memory.
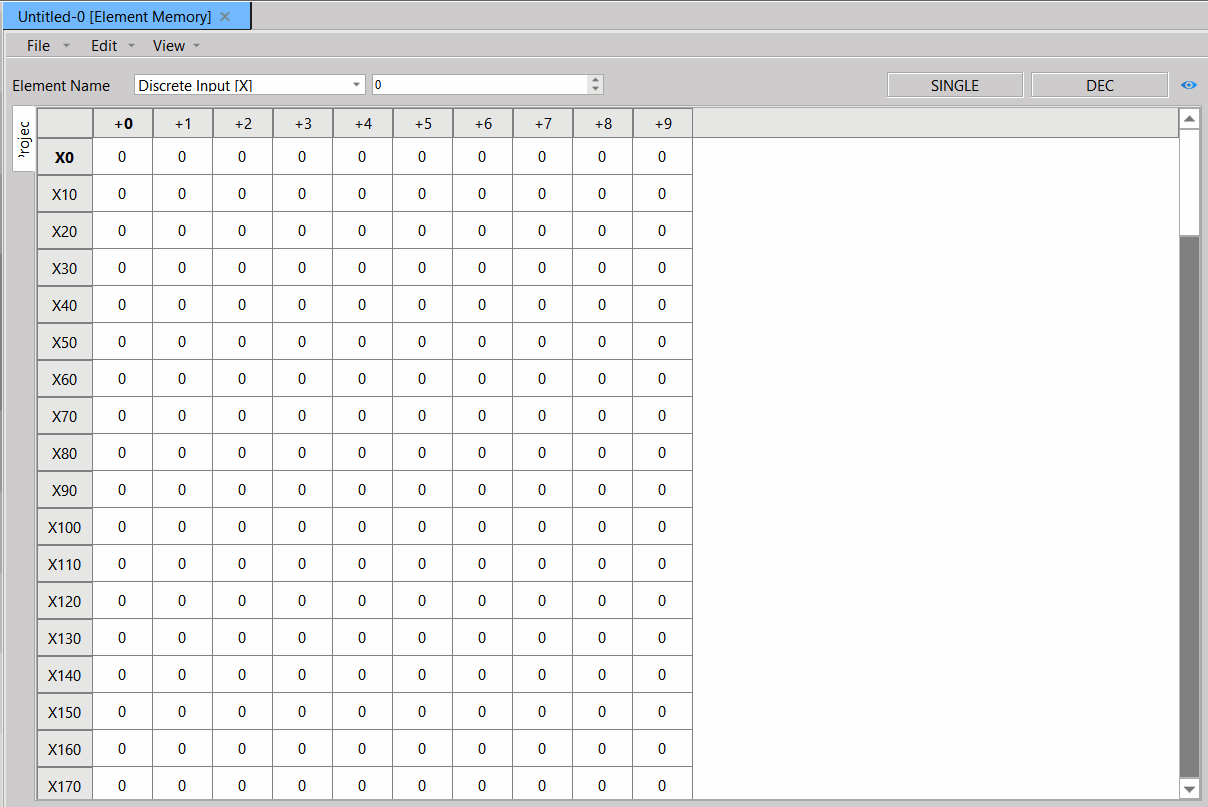
Fig. 270 Element Memory
Functional Area
|
Main Item |
Sub Item |
Description |
|
File |
Import |
Import element memory eettings to current page。 |
|
Export |
Export element memory settings of the current page, with options to select all or partial range |
|
|
Edit |
Undo/Redo/Cut/Copy/Paste/Delete |
Basic editing functions。 |
|
Fill data |
Used to batch set element memory values, with options to select range or specify element range. |
|
|
Read from PLC |
This function is only available when PLC is online. Depending on the selection range or the entire range, the element value can be read by the PLC into the element memory setting. |
|
|
Write to PLC |
This function is only available when PLC is online. Depending on the selection range or the entire range, the element value can be written by the PLC into the element memory setting |
|
|
View |
Single point / Assemble multiple points as WORD / Assemble multiple points as DWORD |
Display mode setting which is set to single point by default. Assemble multiple points as WORD presented as 16-bit groups for components. Assemble multiple points as DWORD presented as 32-bit groups for components. |
|
Decimal / Binary / Hexadecimal / ASCII String / Unsighed decimal / floating |
Display format setting which is set to decimal by default. |
|
|
1 Column / 2 Column / 8 Column / 10 Column / 16 Column |
The editing area column setting which is set to 10 column by default. |
|
|
Original Order / Reverse Order |
The order of the editing area which is set to forward order by default. |
Toolbar Area
|
Description |
|
|---|---|
|
|
Select the element name type that displays on the current page. |
|
|
Jump to the specified element address. |
|
|
Show the current display mode. |
|
|
Enable the element memory monitoring area, and the monitoring area will continuously read the PLC element values when online. |
|
|
Jump to the area with the difference between the element memory and the monitored element values. |




Editing area
In the editing area, you can directly input values or set values through “Fill data” . Any discrepancies with the monitored component values will be displayed in red text on a red background.
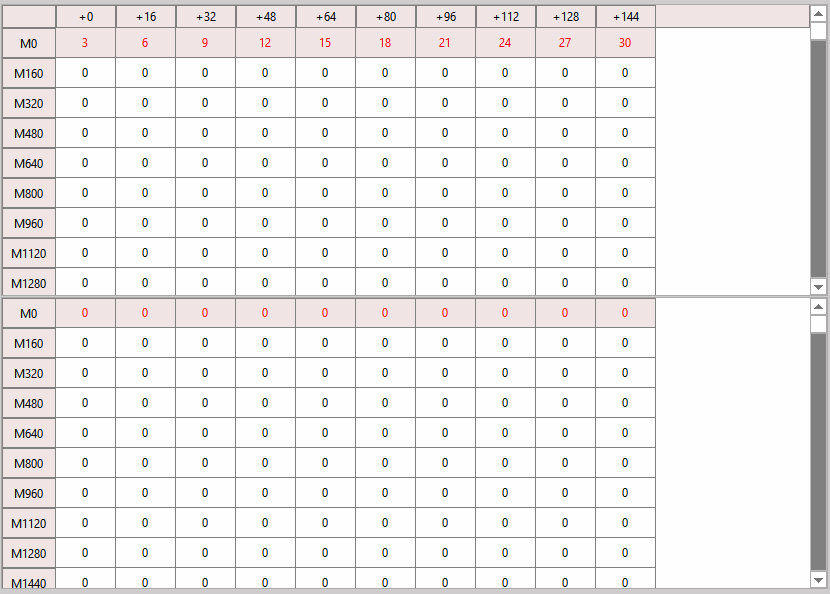
File
- Import
You can access it from the functional area by choosing [ File ] → [ Import ]. Only CSV files exported from the component memory can be imported, and the current component memory values will be overwritten based on the file content.
- Export
You can access it from the functional area by choosing [ File ] → [ Export ].
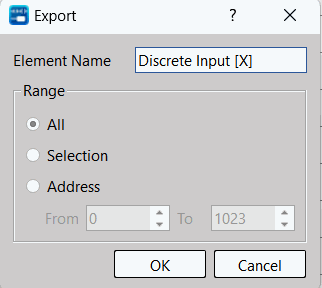
|
Main Item |
Sub Item |
Description |
|
Element Name |
Current element memory name |
|
|
Range |
All |
Export the entire range of the editing area |
|
Selection |
Export the selected range of the editing area |
|
|
address |
Export the specified address range Depending on the display mode, the range may increase. For example, selecting X0~X25 in multiple points as WORD mode, the export range will become X0~X31. |
Editing
- Single setting
You can directly enter strings like ‘100’, ‘1234H’, ‘1010B’, ‘707o’ in the editing area, and the input values will be converted to the current display format.
For single bit elements in single point mode, any input value greater than 0 will be set as 1. The copied/pasted values will also be overflowed based on the current data bits.
- Fill data
You can enter the settings through the functional area by choosing [ Edit ] → [ Fill Data ] , or through the right-click menu by selecting [ Fill Data ] .
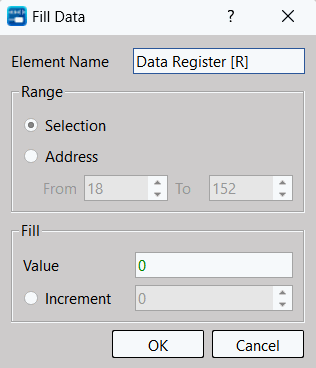
|
Main Item |
Sub Item |
Description |
|
Element name |
Current element memory name |
|
|
Range |
Selection |
Selection range in the editing area before entering fill data. |
|
address |
Specify the address range of the current element memory. |
|
|
Fill |
Value |
Set the value to be written to the element memory. The value input method is the same as in the editing area, and you can input strings such as ‘100’, ‘1234H’, ‘1010B’, ‘707o’, etc. |
|
Increment |
For the set value, the increment value after each write can be positive or negative. Unit components do not support single-point mode or address range input. |
Online
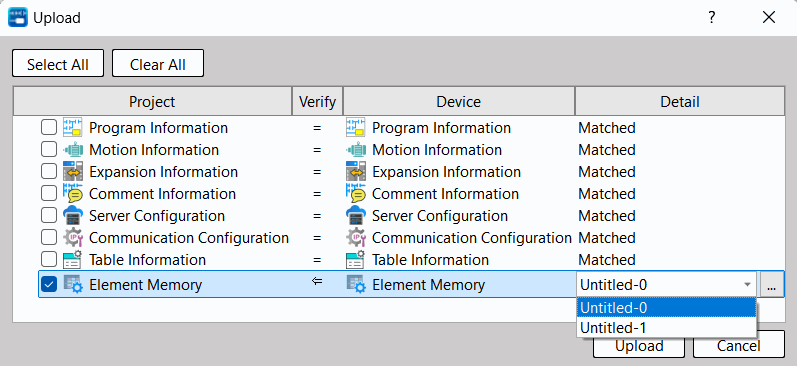
- Upload
When upload without creating project or no element memory table in the project, selecting the element memory will automatically add an element memory table.
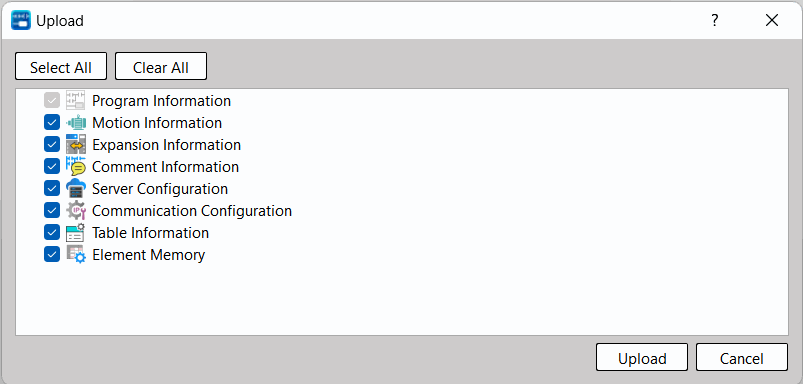
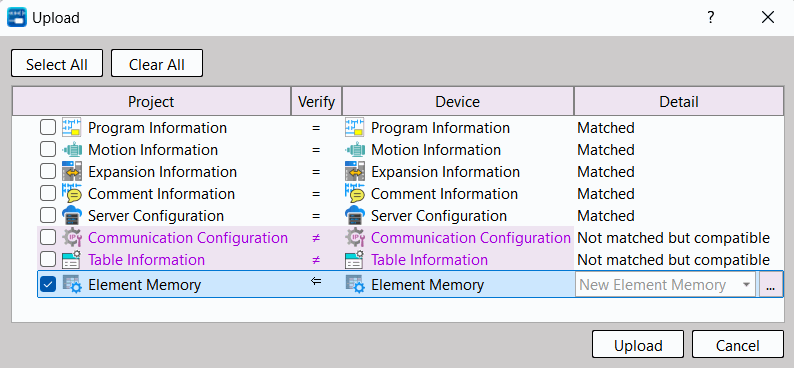
When there are element memory tables in the project, selecting the element memory allows you to choose which element memory table to upload to.
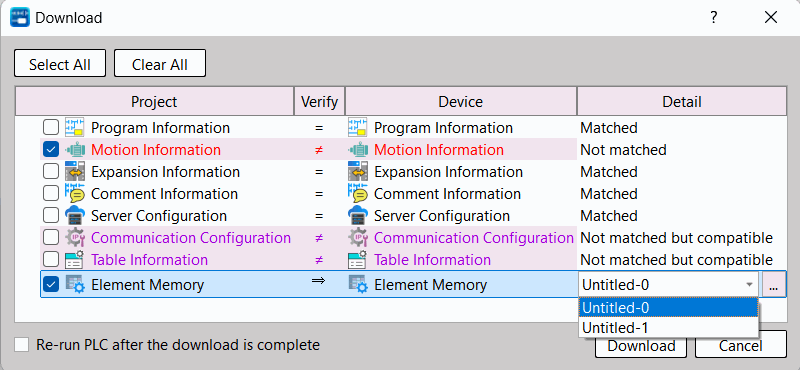
- Download
When there is no element memory table in the project, the element memory option will not appear in the download window.
When there are element memory tables in the project, checking the element memory option allows users to select the specific element memory table to download to.
Online Moniter / Editing
Element memory is not compared during connection. If the project and PLC are identical, online monitoring and editing of element memory are not supported. Users need to use the upload/download function to write or read component memory.
When there are discrepancies between the project and the PLC and element memory is checked, if there is no element memory table in the project, it can only be uploaded, not downloaded. If there are element memory tables in the project, users can specify which element memory table to upload or download.
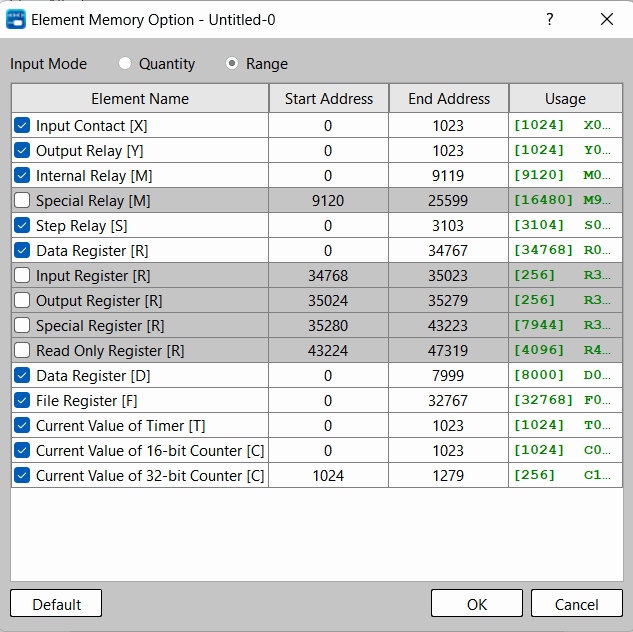
Element Memory Option

Detailed transmission settings can be configured by clicking the right-side button of the specified component memory during the upload/download process.
|
Item |
Description |
|---|---|
|
Input Mode |
You can choose to input data using either "quantity" or "range" as the input method. |
|
Element Name |
Checking this box indicates that this component needs to be uploaded or downloaded. |
|
Quantity |
Set the number of components to be uploaded or downloaded. This option is only displayed when the input mode is set to "Quantity". |
|
Start Address |
Set the starting address of the component to be uploaded or downloaded. |
|
End Address |
Set the ending address of the component to be uploaded or downloaded. This option is only displayed when the input mode is set to "Range". |
|
Usage |
Display the current settings, including the quantity and usage range. If the setting range is incorrect, highlight it in red for emphasis. |
|
Default |
Restore to default settings. To avoid accidental writing, special relays, input registers, output registers, special registers, and read-only registers are not selected by default. |
Tip: press ← → to switch chapters, Ctrl+K to search